Reproducible Performance Metrics for LLM inference
LinkSummary
We’ve seen many claims about LLM performance; however, these claims are often not reproducible.
Today we’re releasing LLMPerf (https://github.com/ray-project/llmperf), an open source project for benchmarking LLMs to make these claims reproducible. We discuss what metrics we selected, and how we measured them.
Interesting insight: 100 input tokens have approximately the same impact on latency as a single output token. If you want to speed things up, reducing output is far more effective than reducing input.
We also show the results of these benchmarks on some current LLM offerings and identify what LLMs are currently best for what. We focus on Llama 2 70b.
To summarize our results on per-token price offerings: Perplexity beta is not yet viable for production due to low rate limits; Fireworks.ai and Anyscale Endpoints are both viable, but Anyscale Endpoints is 15% cheaper and 17% faster on mean end-to-end latency for typical workloads (550 input tokens, 150 output tokens). Fireworks does have slightly better time to first token (TTFT) at high load levels.
Especially when it comes to LLMs, performance characteristics change quickly, each use case has different requirements and the “Your mileage may vary” rule applies.
LinkThe problem
Recently, many people have made claims about their LLM inference performance. However, those claims are often not reproducible and details will be missing, e.g., one such post’s description simply stated the results were for “varying input sizes” and had a graph we literally could not decipher.
We thought about publishing our own benchmarks, but realized that doing that alone would just perpetuate the lack of reproducible results. So in addition to publishing them, we’ve taken our own internal benchmarking tool and are open sourcing it. You can download it here. The README has a number of examples showing how it can be used.
In the rest of this blog, we’ll talk about the key metrics we measure and how various providers perform on these metrics.
LinkQuantitative performance metrics for LLMs
What are the key metrics for LLMs? We propose standardizing on the following metrics:
LinkGeneral metrics
The metrics below are intended for both shared public endpoints as well as dedicated instances.
LinkCompleted requests per minute
In almost all cases, you will want to make concurrent requests to a system. This could be because you are dealing with input from multiple users or perhaps you have a batch inference workload.
In many cases, shared public endpoint providers will throttle you at very low levels unless you come to some additional arrangement with them. We’ve seen some providers throttle to no more than 3 requests in 90 seconds.
LinkTime to first token (TTFT)
In streaming applications, the TTFT is how long before the LLM returns the first token. We are interested not just in the mean TTFT, but the distribution: the P50, P90, P95 and P99.
LinkInter-token latency (ITL)
Inter-token latency is the average time between consecutive tokens. We’ve decided to include the TTFT in the inter-token latency computation. We’ve seen some systems that start streaming very late in the end-to-end-time.
LinkEnd-to-end Latency
The end to end latency should approximately be the same as the average output length of tokens multiplied by the inter-token latency.
LinkCost per typical request
API providers can usually trade off one of the other metrics for cost. For example, you can reduce latency by running the same model on more GPUs or using higher-end GPUs.
LinkAdditional metrics for dedicated instances
If you’re running an LLM using dedicated compute, e.g., with Anyscale Private Endpoints, there are a number of additional criteria. Note that it is very hard to compare performance on shared LLM instances with dedicated LLM instances: the constraints are different and utilization becomes a far more significant practical issue.
LinkConfigurations
It’s also important to note that the same model can often be configured differently which leads to different tradeoffs between latency, cost, and throughput. For example, a CodeLlama 34B model running on a p4de instance can be configured as 8 replicas with 1 GPU each, 4 replicas with 2 GPUs each, 2 replicas with 4 GPUs each, or even 1 replica with all 8 GPUs. You can also configure multiple GPUs for pipeline parallelism or tensor parallelism. Each one of these configurations has different characteristics: 8 replicas with one GPU each is likely to be the lowest TTFT (because there are 8 “queues” waiting for input), while 1 replica with 8 GPUs is likely to be the greatest throughput (because there is more memory for batches and because there is effectively 8x the memory bandwidth).
Each configuration will lead to different benchmark results.
LinkOutput token throughput
There is one additional criterion which is important: total generated token throughput. This allows you to make cost comparisons.
LinkCost per million tokens at full utilization
In order to compare the cost of different configurations (e.g. you could serve a Llama 2 7B model on 1 A10G GPU, 2 A10G GPUs, or 1 A100-40GB GPU, etc), it is important to consider the total cost of the deployment for the given output. For the purposes of these comparisons, we will use AWS 1 year reserved instance pricing.
LinkMetrics we considered but did not include
There are of course other metrics we could add to this list.
LinkPrefill time (yet)
Because prefill time can only be measured indirectly by doing regression on the time-to-first token as a function of the input size, we have chosen not to include it in this first round of benchmarks. We plan to add prefill time to a future version of the benchmark.
In our experience with most current technologies we do not find that prefill time (taking the input tokens, loading them onto the GPU and computing the attention values) contributes significantly to latency as the output tokens.
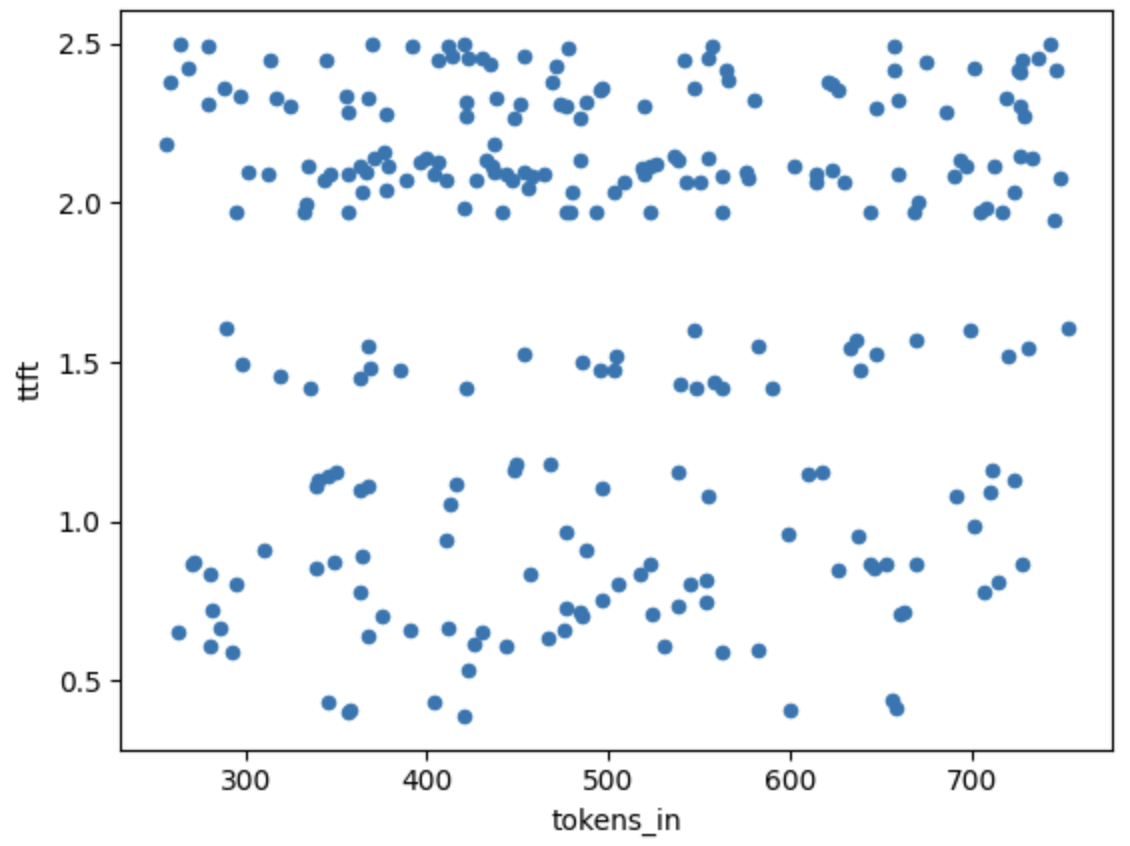
This figure shows the variation in the time to first token (TTFT) as compared to the size of the input. All of these samples are from a single run (5 concurrent requests). All of these data points would be averaged to give a single sample point in the following graphs.
You can see that there does not seem to be any discernible relationship between input tokens and TTFT between 250 token input and 800 token input and it is “swamped” by the random noise in TTFT due to other causes. We did actually try to estimate this using regression by comparing the output of 550 input tokens and 3500 input tokens and estimating the gradient, and we found that each additional input token adds 0.3-0.7ms to the end-to-end time, compared to each output token which adds 30-60 ms to the end-to-end time (for Llama 2 70b on Anyscale Endpoints). Thus input tokens have approximately 1% of the impact of output tokens on end-to-end latency. We will come back to measuring this in future.
LinkTotal throughput (including input and generated tokens)
Given the prefill time is not measurable and that the time taken is a function of the generated tokens more than of the size of the input, we feel focusing on output is the right choice.
LinkChoice of input
When running this test, we need to choose the input to use for testing, as well as the rate.
We’ve seen people use random tokens to generate fixed-size input and then use a hard stop on max tokens to control the size of the output. We believe this is suboptimal for 2 reasons:
Random tokens are not representative of real data. Therefore, certain performance optimization algorithms that rely on real distribution of data (such as, say, speculative decoding) might appear to perform worse on random data than real data.
Fixed sizes are not representative of real data. This means that the benefits of certain algorithms such as paged attention and continuous batching would not be captured: a lot of their innovation is in dealing with variations in input and output sizes.
Hence we want to use “real” data. Obviously this varies from application to application, but we want at least an average to start with.
LinkSize of input
To determine a “typical” input size and output size, we looked at the data we’ve seen from Anyscale Endpoints users. Rounding based on this, we chose:
Mean input length: 550 tokens (standard deviation 150 tokens)
Mean output length: 150 tokens (standard deviation 20 tokens)
We assume for simplicity that the input and output are normally distributed. In future work, we will consider more representative distributions such as Poisson distributions (which have better properties for modeling token distributions, e.g., Poisson distributions are 0 for negative values). When counting tokens we always use the Llama 2 fast tokenizer to estimate the number of tokens in a system independent way – we’ve noticed in past research, for example, that the ChatGPT tokenizer is more “efficient” than the Llama tokenizer (1.5 tokens per word for Llama 2 vs 1.33 tokens per word for ChatGPT). ChatGPT shouldn’t be penalized for this.
LinkContent of input
To make the benchmark representative, we have decided to give two tasks for the LLM to do.
The first is converting word representations of numerals to digital representations. This is effectively a “checksum” to make sure the LLM is functioning correctly: with high probability we should expect the returned value to be what we sent (in our experience we rarely see this fall below 97% in well functioning LLMs).
The second is a task to give us more flexibility on input and output. We include a certain number of lines from Shakespeare’s sonnets in the input and ask the LLM to select a certain number of lines in the output. This gives us a distribution of tokens and sizes that is realistic. We can also use this to “sanity check” the LLM – we should expect that the output lines look somewhat like the lines we provide.
LinkConcurrent requests
A key characteristic is the number of requests made concurrently. Obviously more concurrent requests will slow down output for a fixed resource set. For testing, we have standardized on 5 as the key number.
LinkLLMPerf
LLMPerf implements the measures above. It is also parameterized (such as allowing you to change input and output sizes to match those of your applications, so you can run benchmarks of providers for your own work).
LLMPerf is available here: https://github.com/ray-project/LLMPerf
LinkBenchmarking results for per-token LLM products
As we mentioned above, it is difficult to compare per-token (typically shared) LLM products with per-minute products where you pay for the product based on units of time. For these experiments, we focus on the per-token products that we are aware of. We therefore chose llama-2-70b-chat on Anyscale, Fireworks, and Perplexity. For Fireworks, we used a Developer PRO account (increases the rate limit to 100 requests per minute).
LinkCompleted requests per minute
We used this to measure how many requests could be made per minute by changing the number of concurrent requests, and seeing how the overall time changed. We then divided the number of completed requests by the time it took in minutes to complete all the requests.
Note this may be slightly conservative since we completed the concurrent requests in “rounds” rather than as continuous querying. For example if we are making 5 concurrent requests, and 4 of them finish in 5 seconds, and one of them finishes in 6 seconds, there is one second which is not fully 5 concurrent requests.
The graph below shows the results.
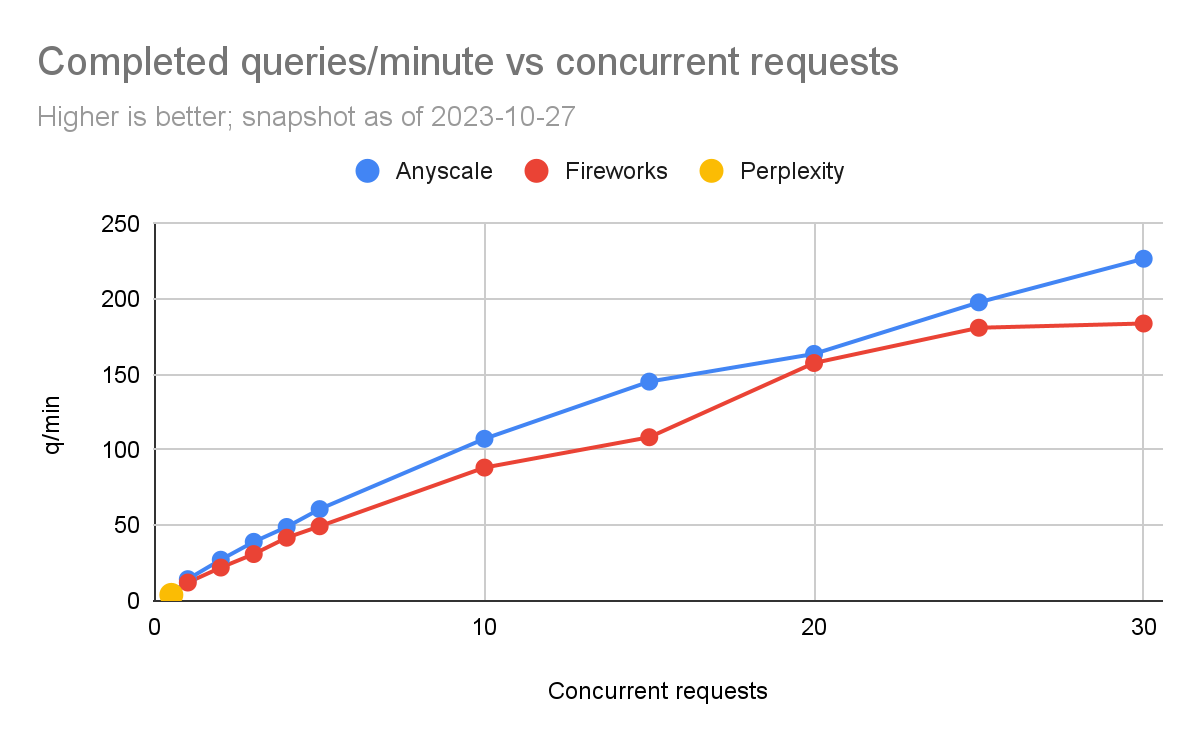
One thing we had to deal with was that Perplexity had very low rate limits. We were therefore only able to complete an “apples to apples” comparison with a 15 second pause between rounds. Any less than that and we would start to get exceptions from Perplexity. We labeled this as 0.5 concurrent requests per second. We ran the experiments until we started getting exceptions.
We can see that both Fireworks and Anyscale can scale up to hundreds of completed queries per minute. Anyscale can scale slightly higher (maxing out at 227 queries per minute vs 184 queries per minute for Fireworks).
LinkTTFT
We compared the TTFT for each of the products. TTFT is especially important for streaming applications, such as chatbots.
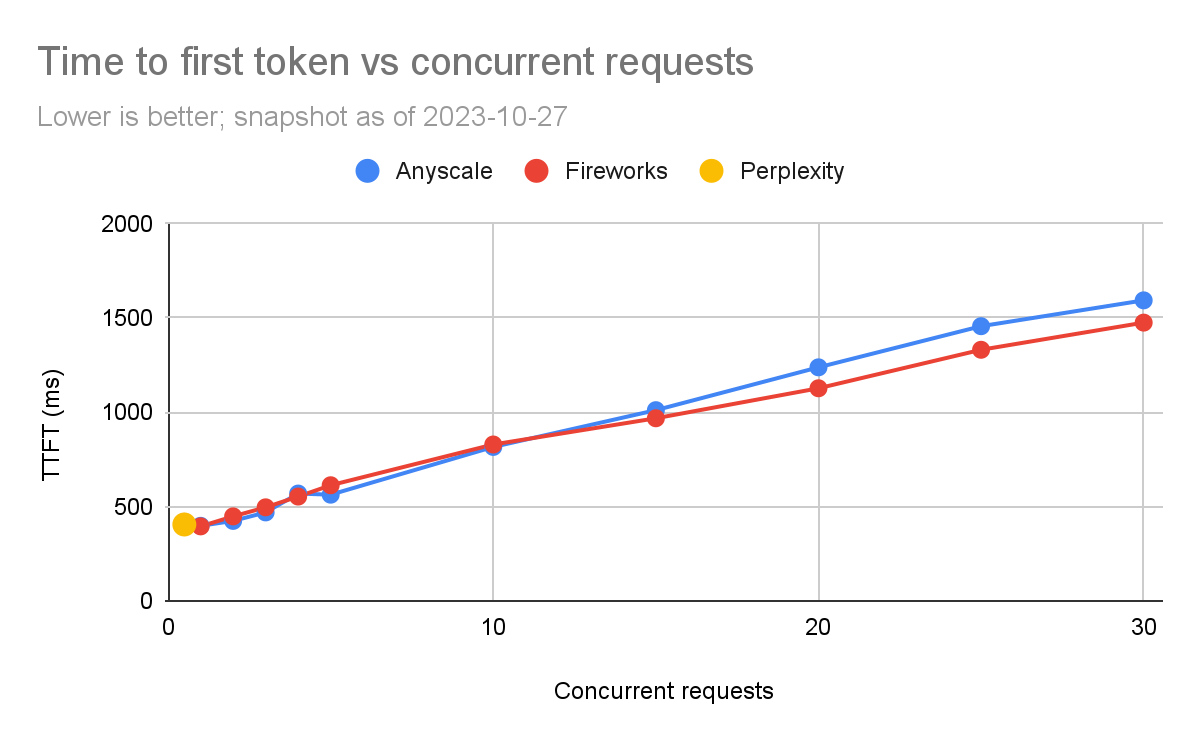
Once again, we are limited in how far we can test Perplexity. Initially for low load levels, Anyscale is faster, but as the number of concurrent requests increases, Fireworks seems to be slightly better. At 5 concurrent queries (which is what we tend to focus on) the latencies are usually within 100 milliseconds (563 ms vs 630 ms). It must also be noted that TTFTs have high variance with the network (e.g., if the service is deployed in a nearby or far region).
LinkInter-Token Latency
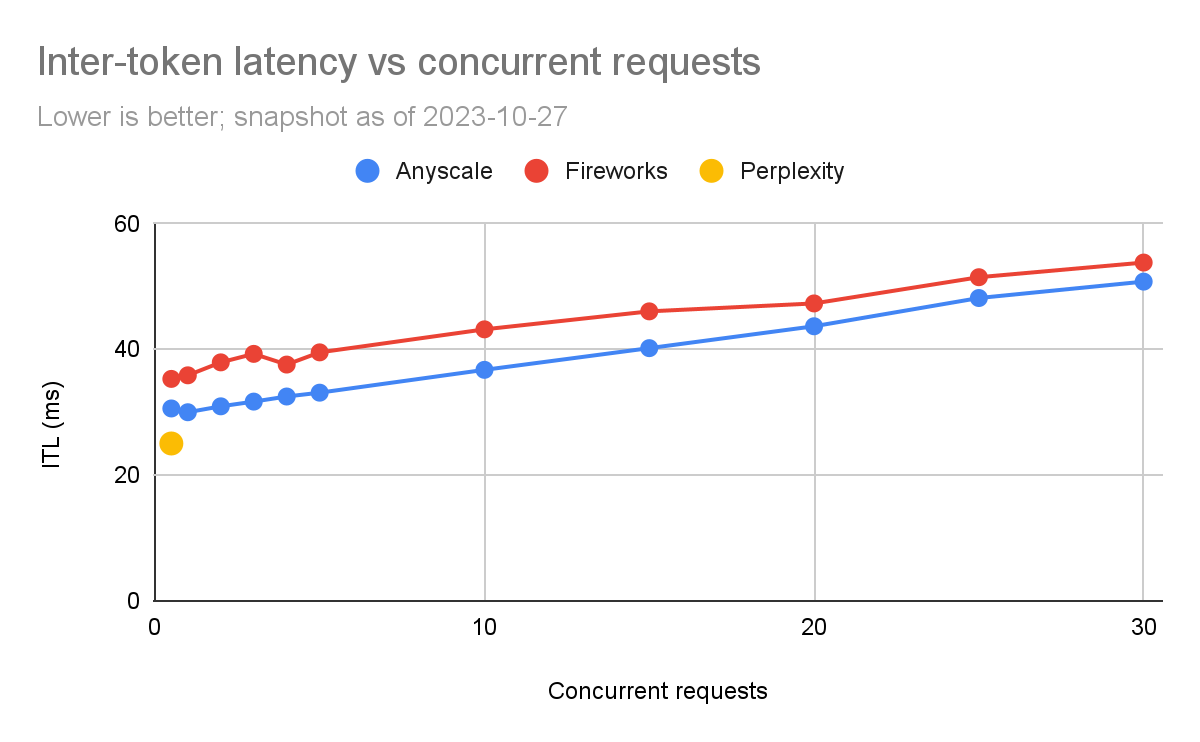
We can see in the above that the inter-token latency on Anyscale is consistently better than Fireworks, although the differences are relatively small (~5% to 20%).
LinkEnd-to-End time
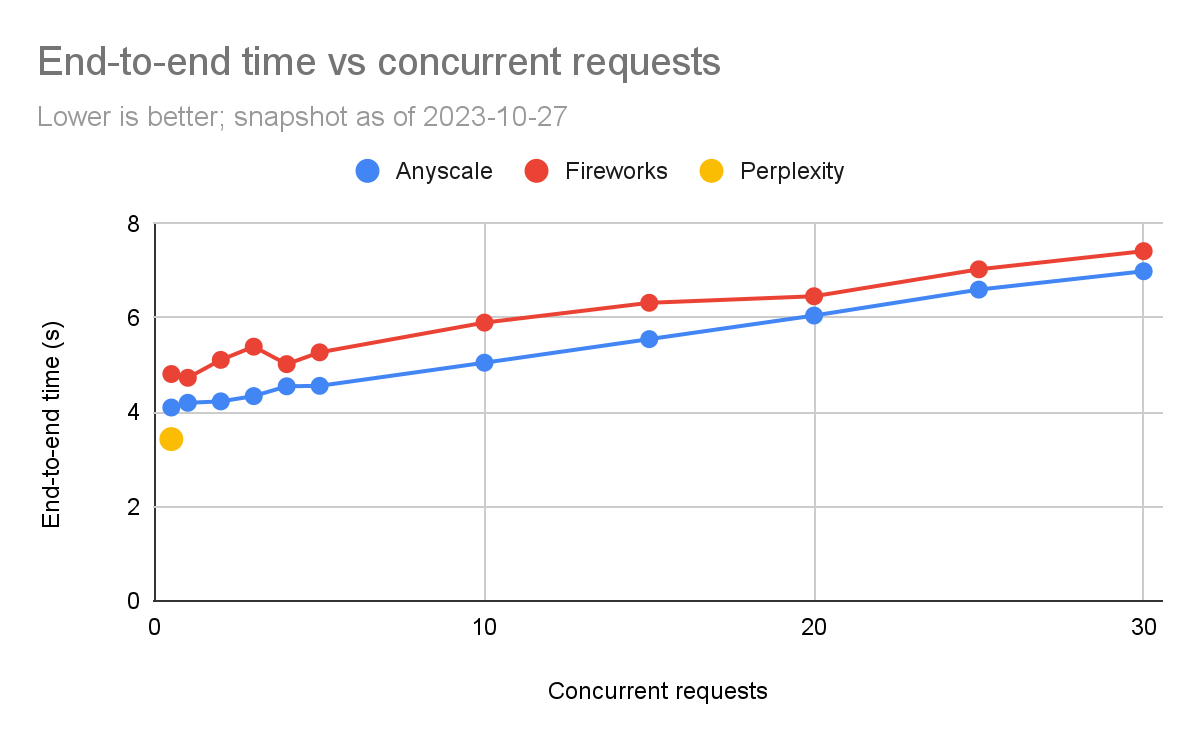
The graph below shows the end-to-end time required to complete queries. We can see that end-to-end request time is one of the more sensitive measures in terms of noise.

We can see here that the Anyscale’s end-to-end time is consistently better than Fireworks’s, but the gap closes (especially proportionately) at high load levels. At 5 concurrent queries, Anyscale is 4.6 seconds vs 5.3 seconds (15% faster). But at 30 concurrent queries, the difference is smaller (Anyscale is 5% faster).
LinkCost per thousand requests
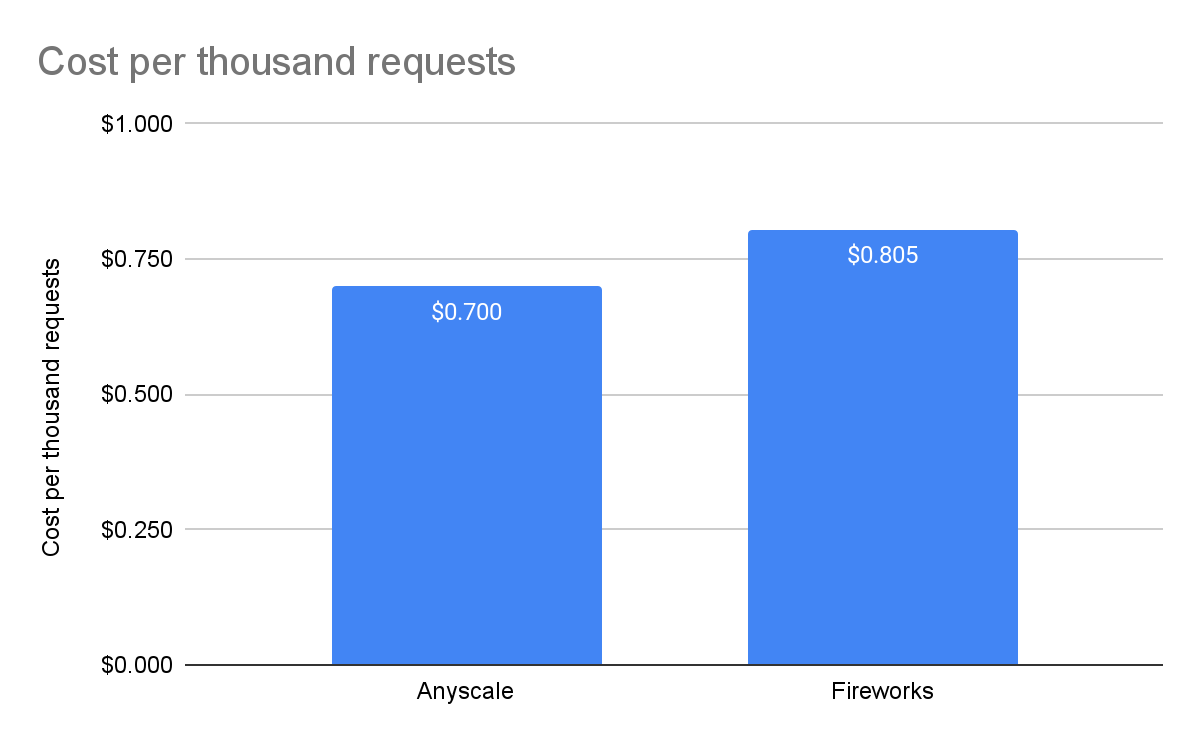
Perplexity is in open beta so there is no price – we could not include it in the comparison. For Fireworks, we used the prices listed on their website, which is $0.7 per million tokens in and $2.80 per million tokens out. For Anyscale Endpoints, we used $1 per million tokens regardless of input or output as listed on the pricing page.
LinkInterpreting these results
Now that we have these numbers, we can work out when to use each LLM product:
For a low traffic interactive application (like a chatbot), any of these three will do. The ITL and TTFT are small enough to not be a major issue and there’s not a major difference since humans read at something like 5 tokens per second and even the slowest is 6 times that. However, Anyscale is the cheapest of the 3, by about 15% for this workload.
If you’re looking for ultra-low latency applications end-to-end and you don’t have too much work to do, Perplexity is worth considering once they come out of open beta. It’s hard to know what the “cost” of that low latency is until Perplexity releases prices.
If you have large workloads, Anyscale and Fireworks are worth considering. However, Anyscale for this particular workload is 15% cheaper. If you had a high input to output ratio, for example 10 input tokens to 1 output token, Fireworks would be cheaper (89c for Fireworks vs $1 for Anyscale). An example of this might be extreme summarization.
LinkConclusions
LLM performance is evolving incredibly rapidly. We hope that the community finds the LLMPerf benchmarking tool useful for comparing outputs. We will continue to work on improving LLMPerf (in particular to make it easier to control the distribution of inputs and outputs) in the hope that it will improve transparency and reproducibility. We also hope you will be able to use it to model cost and performance for your particular workloads.
We see from this that it’s not a one-size fits all for benchmarks and that especially in the case of LLMs, it really depends on your particular application.
Table of contents
- Summary
- The problem
- Quantitative performance metrics for LLMs
- General metrics
- Additional metrics for dedicated instances
- Configurations
- Output token throughput
- Cost per million tokens at full utilization
- Metrics we considered but did not include
- Prefill time (yet)
- Total throughput (including input and generated tokens)
- Choice of input
- Size of input
- Content of input
- Concurrent requests
- LLMPerf
- Benchmarking results for per-token LLM products
- Completed requests per minute
- TTFT
- Inter-Token Latency
- End-to-End time
- Cost per thousand requests
- Interpreting these results
- Conclusions
Sharing
Sign up for product updates
Ready to try Anyscale?
Access Anyscale today to see how companies using Anyscale and Ray benefit from rapid time-to-market and faster iterations across the entire AI lifecycle.


