Monitoring and Debugging Ray workloads: Ray Metrics
As people use Ray in production environments, monitoring and debugging have become a necessity to observe the health of Ray production workloads.
Not surprisingly, one of the most popular talks at the Ray Summit 2022 was Ray Observability: Past and Future. After announcing the new dashboard and state observability APIs in Ray 2.0, we follow with a new feature displaying native time series metrics as part of Ray 2.1. In this blog, we explore how you can view these metrics to garner insights into the scheduling and performance of your Ray workloads.

Time series metrics are one of the most important monitoring tools in distributed systems. In Ray, there are numerous concurrent activities across many machines, making it difficult to assess the system states at a glance.
From the Ray 2.1 release, Ray's dashboard displays a set of selected time series graphs to help understand critical system states such as scheduler slot usage, CPU/GPU utilization, memory usage, and states of running tasks over time. Additionally, it provides easy integration into a popular monitoring system, Prometheus, and a default visualization with the Grafana dashboard.
LinkGetting started
Ray has easy integration with Prometheus and Grafana, which you'll need to install in order to view Ray time series metrics. Ray provides default configuration files to set up Prometheus and Grafana, available from “/tmp/ray/session_*” folder.
Note: In Anyscale, metrics can be viewed by clicking "Ray Dashboard > Metrics" in the cluster UI. This feature is available in Ray 2.1+ cluster environments.
First, let’s start a ray instance.
1ray stop --force && ray start --headNow download the Prometheus and start the Prometheus server with the default configuration file.
1./prometheus --config.file=/tmp/ray/session_latest/metrics/prometheus/prometheus.yml The Prometheus server can automatically discover all of the Ray nodes from the cluster through the pre-generated service discovery file.
Next, let’s download Grafana and start the Grafana server with the default configuration file.
1./bin/grafana-server --config /tmp/ray/session_latest/metrics/grafana/grafana.ini webAnd finally, go to the Grafana URL (localhost:3000) and log in with the default credentials (ID and password are both “admin” by default when you start a fresh new Grafana instance). Now you are all set.
All the pre-created dashboard is now available at the Ray dashboard. Let’s go to the dashboard URL (localhost:8265) and open the Metrics tab on the left navigation bar.
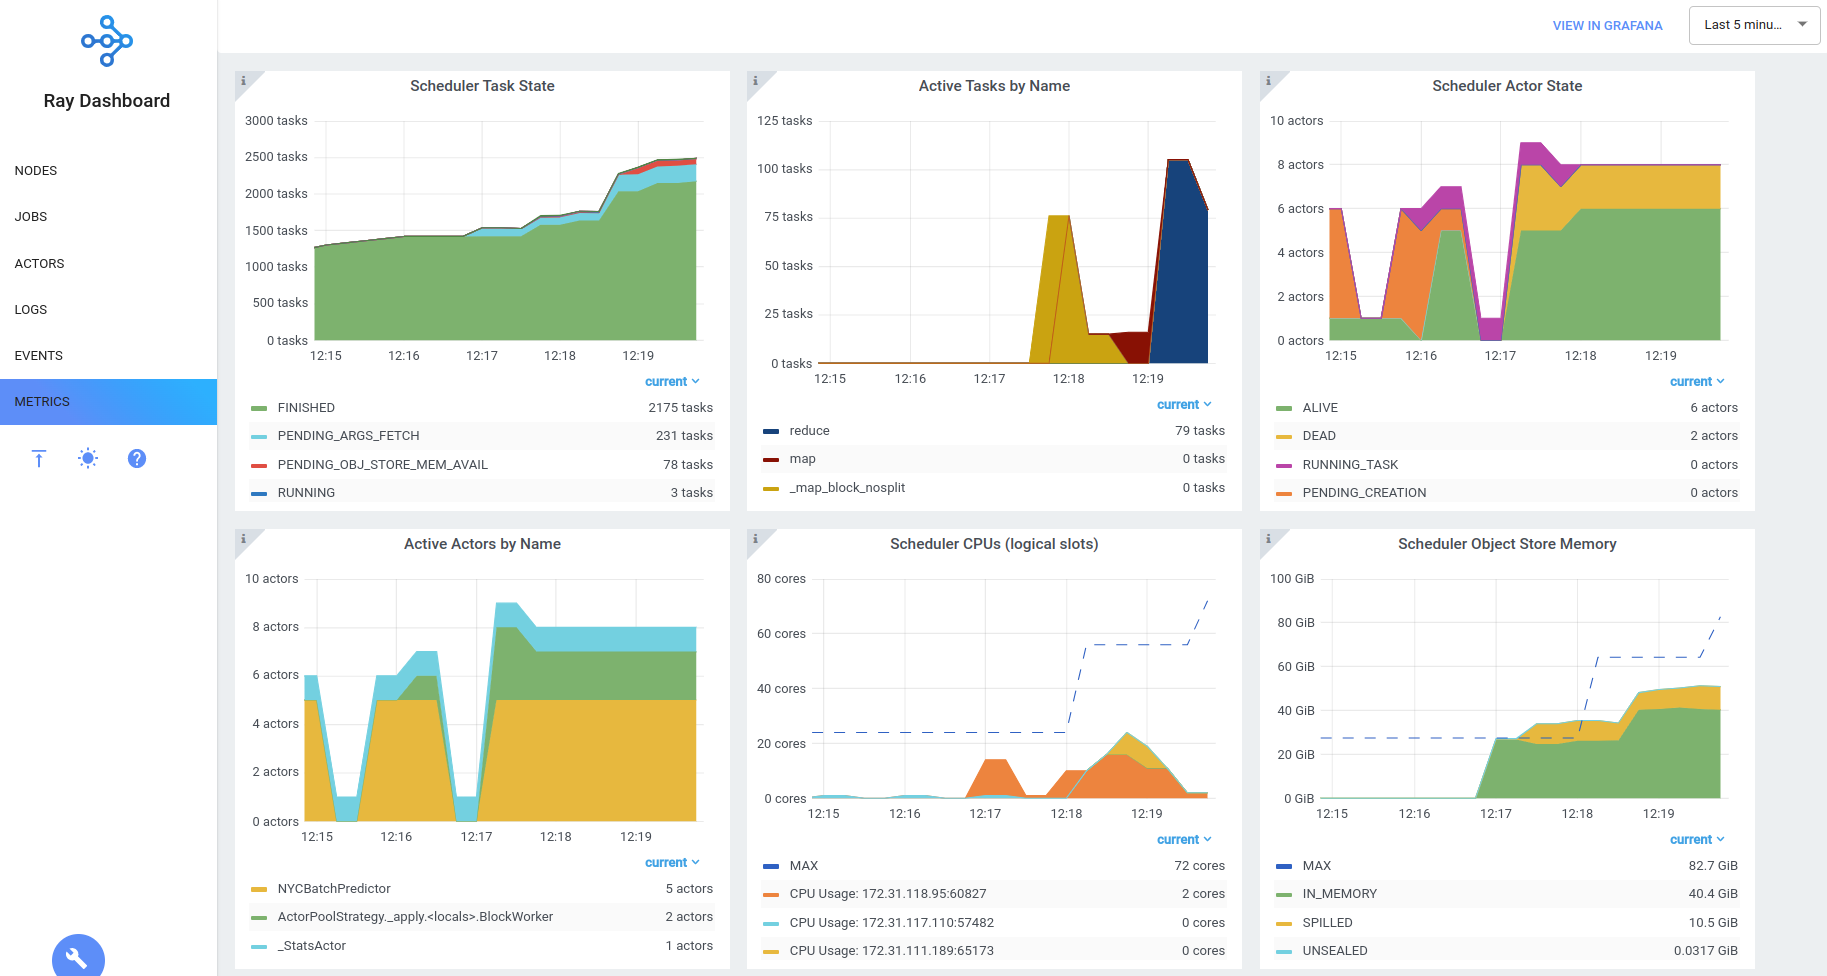 Figure 1. Sample time series charts now available in the new Metrics dashboard.
The above charts are rendered by Grafana, and you can via selecting "View in Grafana" for more advanced queries.
LinkDeep dive into metrics collection
In the sections below, we explain what metrics are garnered from Ray activities for tasks, object store, cluster-wide resource usage, and autoscaling status. Let’s consider Task states first.
LinkTask states
The scheduler task state graph displays the total number of existing tasks categorized by their state. It’s easy to discern how many tasks are concurrently running, pending due to the lack of plasma store memory, or failing over time. Task breakdowns are available by State (default), Name, and InstanceId.
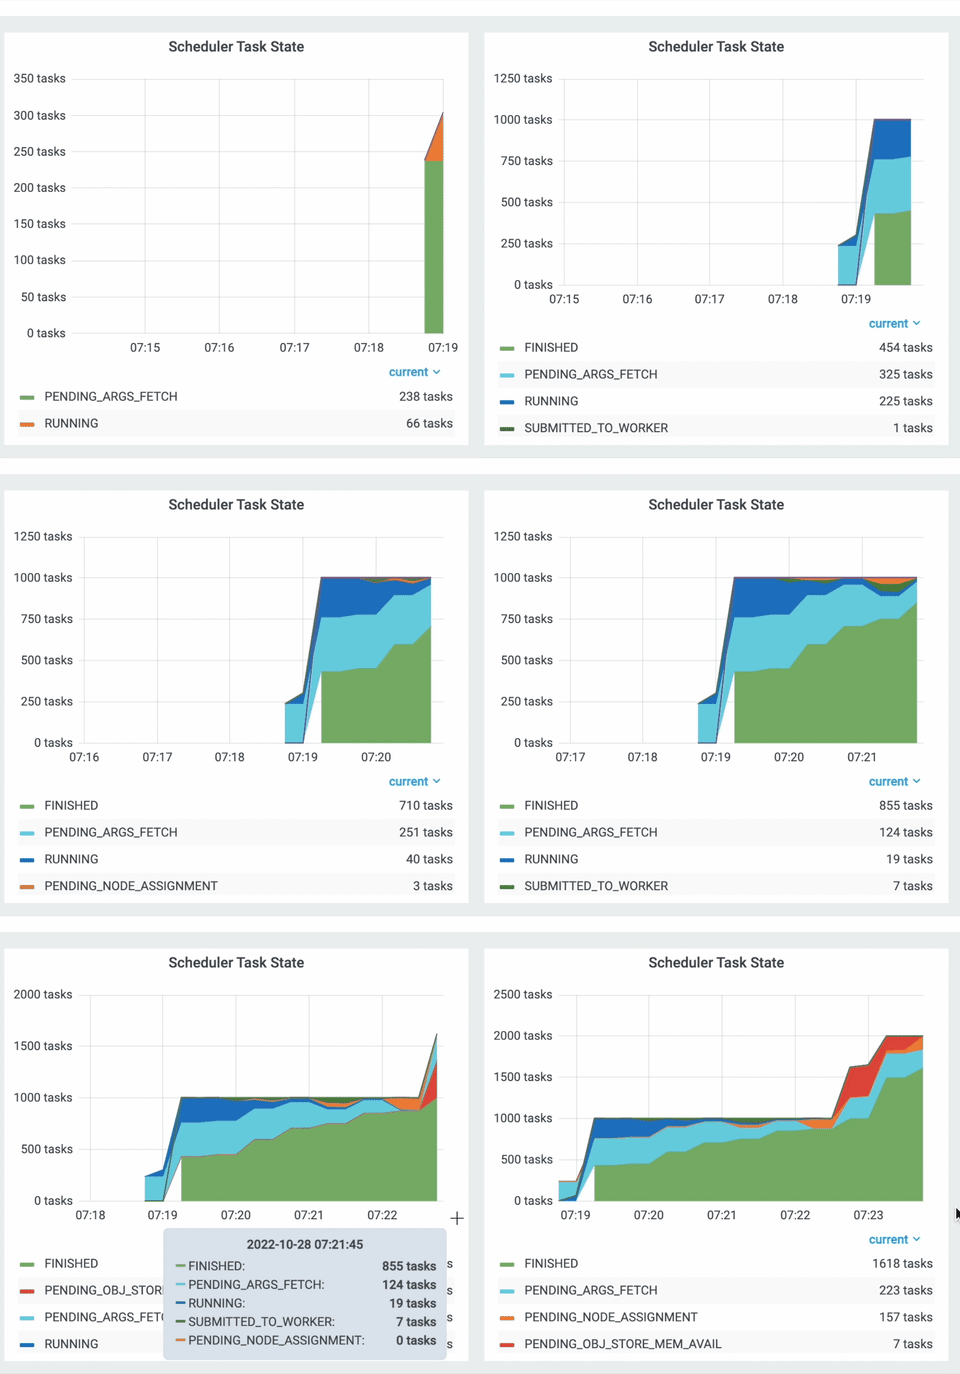 Figure 2. Distributed 1TB sort in action.
 In the above chart, you can see the first wave of sort map tasks run (blue) and then complete (green), followed by the execution of a wave of sort reduce tasks, which block on data fetch from the object store (red) prior to execution.
LinkObject store memory
The object store usage graph shows memory used by Ray objects in the cluster, broken down by whether they are in-memory, spilled to disk, or in temporary buffers (not yet fully created). Memory breakdowns are available by State (default) and InstanceId.
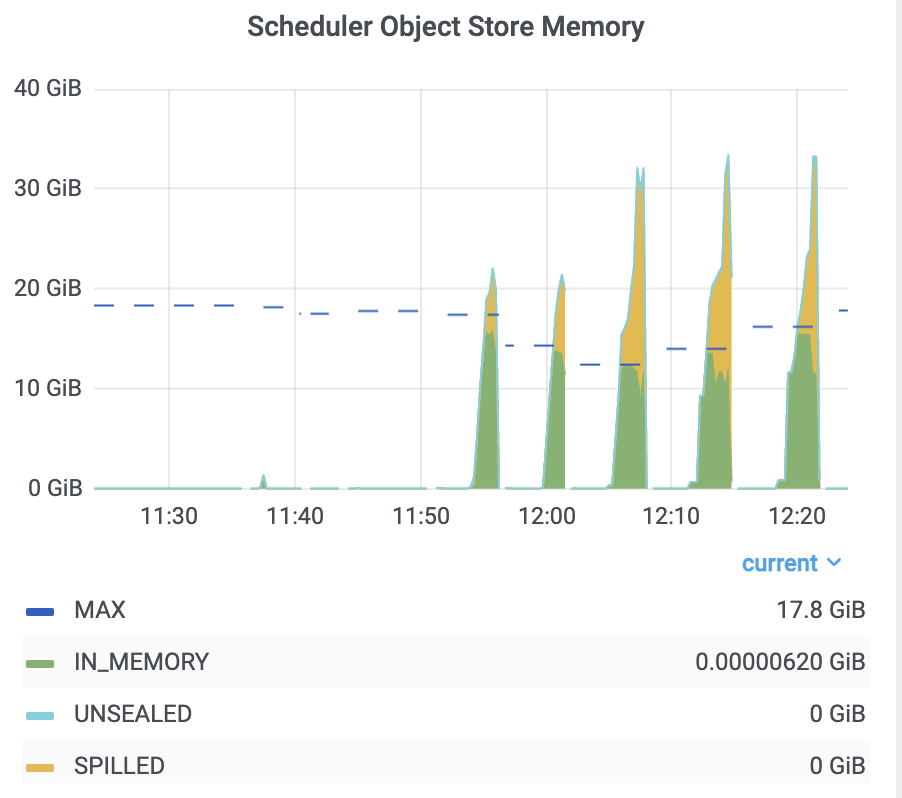 Figure 3. Ray objects in their varying memory state.
In the Figure 3 display, you can visualize five executions of a memory-intensive workload on a Ray cluster. You can see the objects that Ray decides to spill to disk (yellow) when the memory usage exceeds the available object store size (dashed blue line).
LinkLogical resource Usage
Ray users declare the required logical resource of tasks and actors via arguments of ray.remote (e.g., num_cpus and num_gpus). Before Ray 2.1, a snapshot of logical resources usage can be viewed using the ray status CLI command.
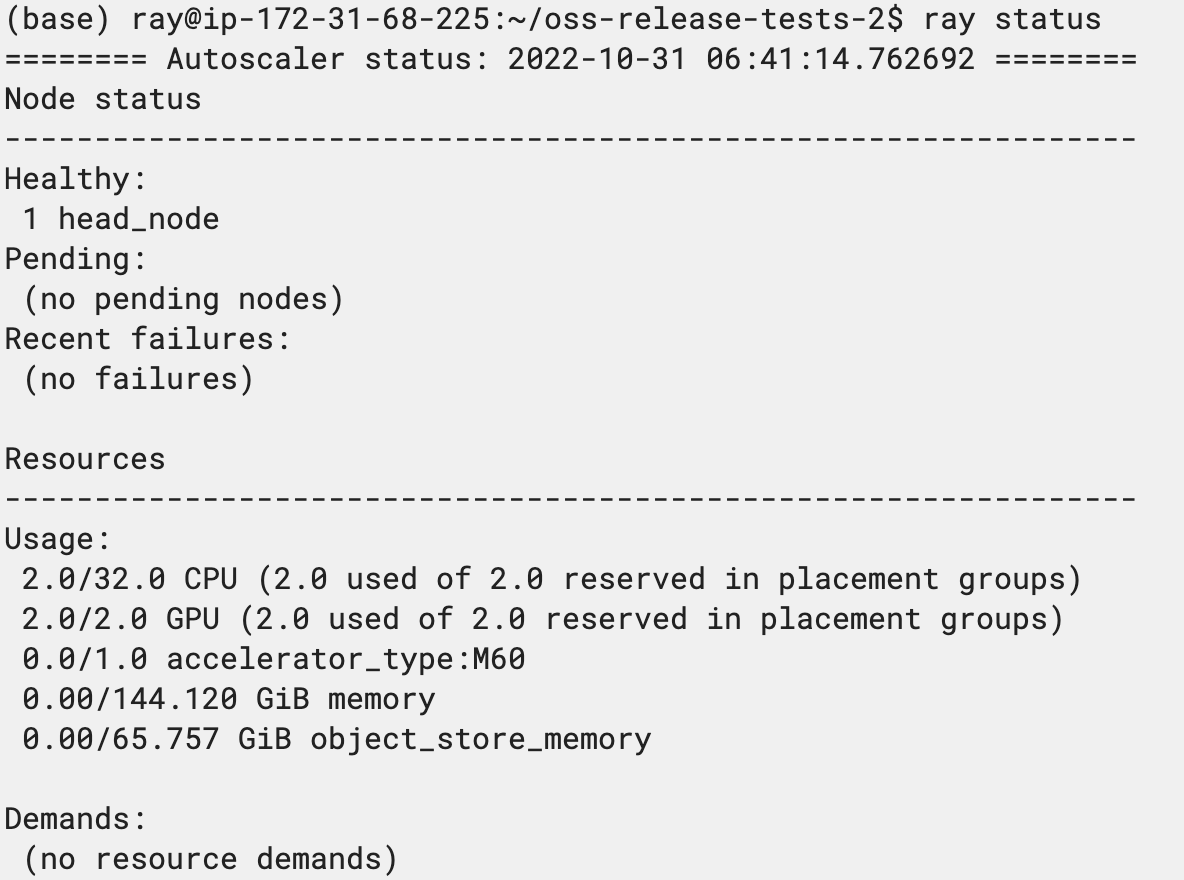 Figure 4. The output from the command line status command
The output of ray status shows a running RL workload on a multi-GPU. The command from output only displays the snapshot of the current logical resource usages. Two GPUs are currently in use.
From Ray 2.1, the time series dashboard also provides the logical CPU and GPU usage over time, which helps users understand how Ray schedules tasks and actors over physical nodes.
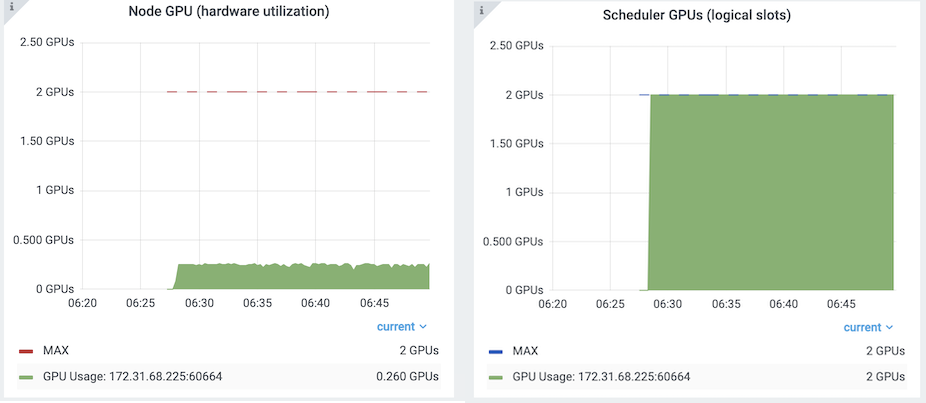 Figure 5. Comparison between physical (left) and logical (right) GPU usage
In the above comparison chart, on the left, you can see that the GPUs are lightly utilized. However, on the right you can see the Ray scheduler has reserved both GPUs fully for the workload. To optimize usage, you could consider using fractional GPUs per actor (e.g., ray.remote(num_gpus=0.2)).
LinkPhysical Resource Usage
In the past, understanding the utilization of Ray clusters was challenging. While Ray’s dashboard provides a snapshot of cluster utilization of the cluster, it was difficult to understand the utilization of the cluster at a glance.
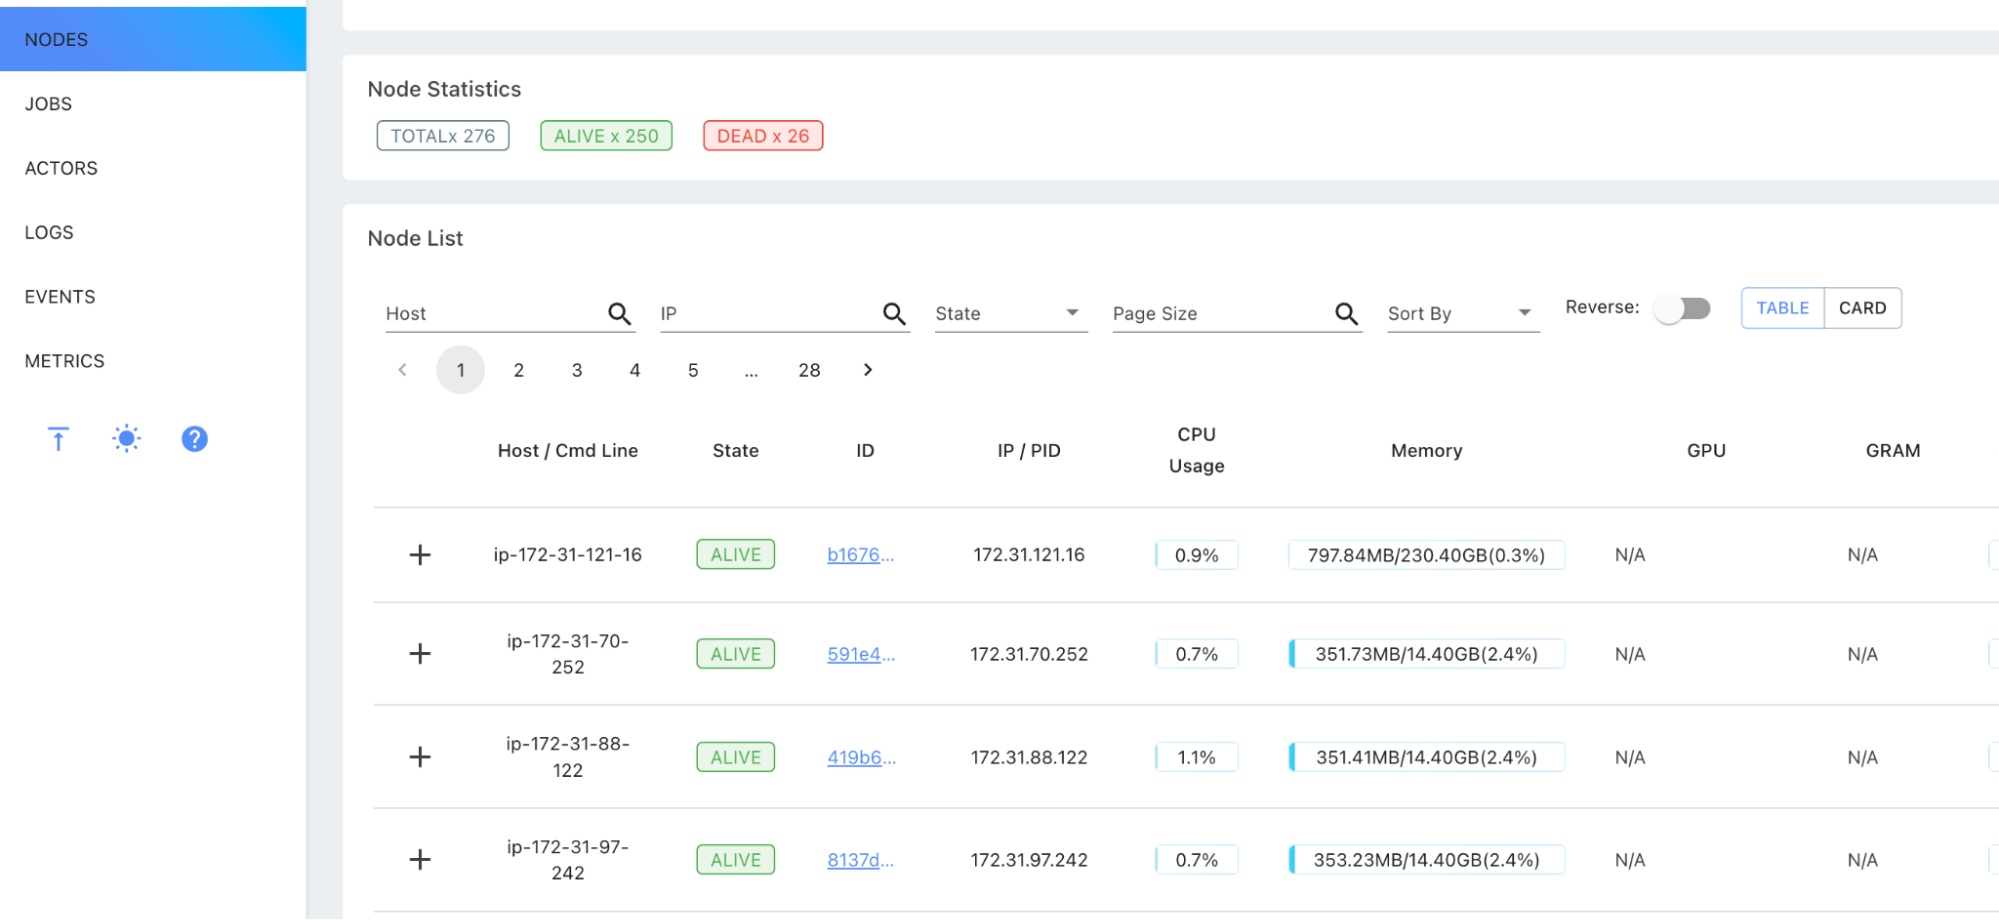 Figure 6. The previous version of the dashboard without time series metrics
The previous versions of Ray only showed a snapshot of physical resource utilization, whereas in Ray 2.1, as shown in Figure 6, it exposes time series charts for both physical and logical resource slot usage.
From the 2.1 release, Ray provides various cluster utilization metrics such as CPU/GPU utilization, memory usage, disk usage, object store usage, or network speed. You can easily see the utilization of the cluster by looking at the time series graph from the Ray dashboard.
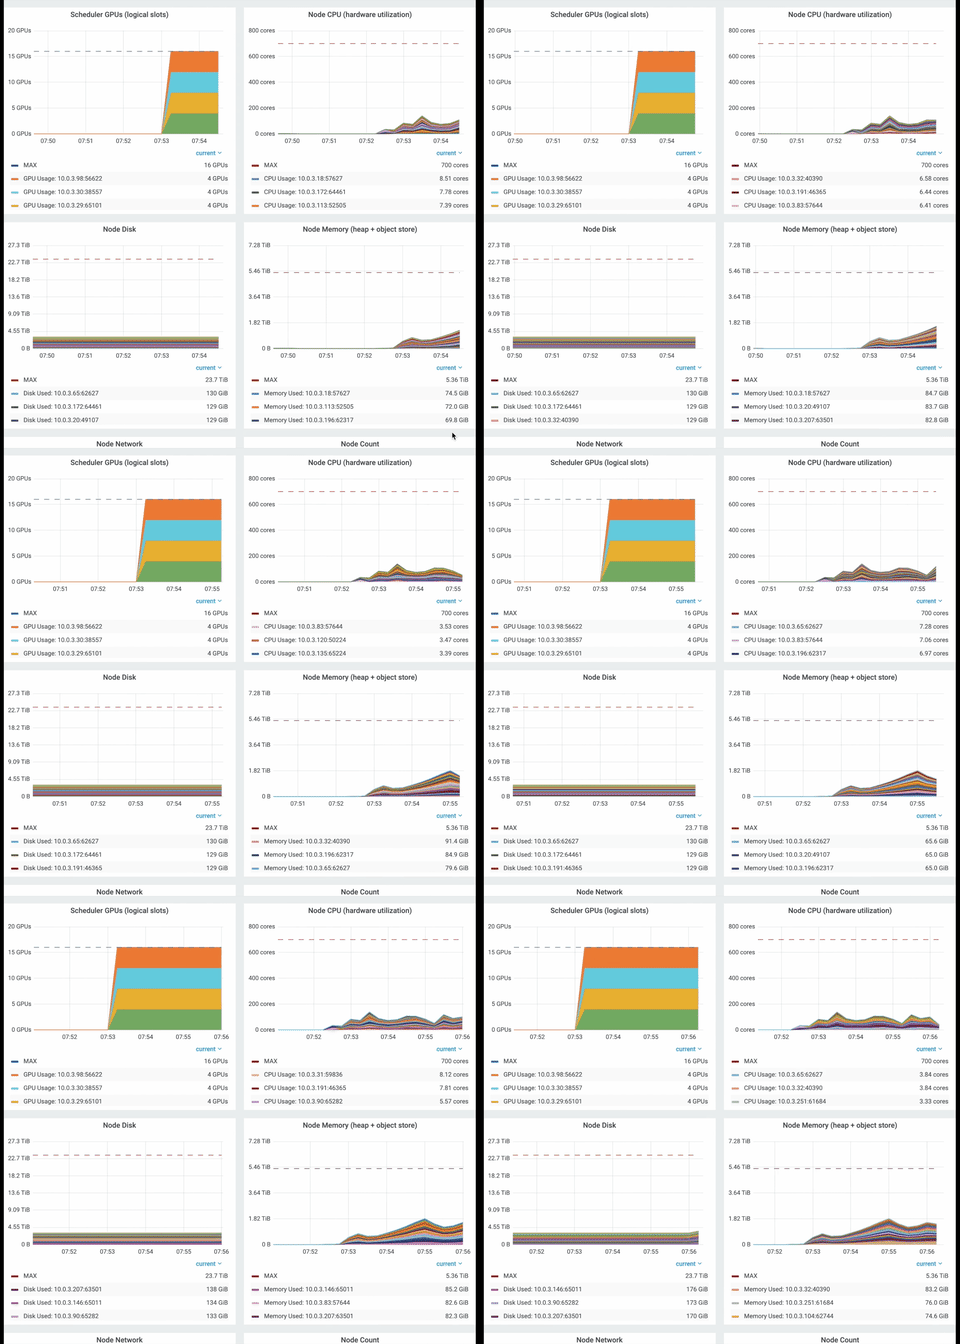 Figure 7. Charts showing cluster utilization during a Ray data load
The charts in Figure 7 display the cluster utilization while using Ray Datasets to load data for training with Ray Train. This workload generates high network usage for reading data from cloud storage, as well as high GPU usage for training.
LinkAutoscaling status
The number of alive, pending, and failed nodes of the cluster is now available as time series metrics. The graph helps you figure out the autoscaling status of the cluster as well as if there are any node failures.
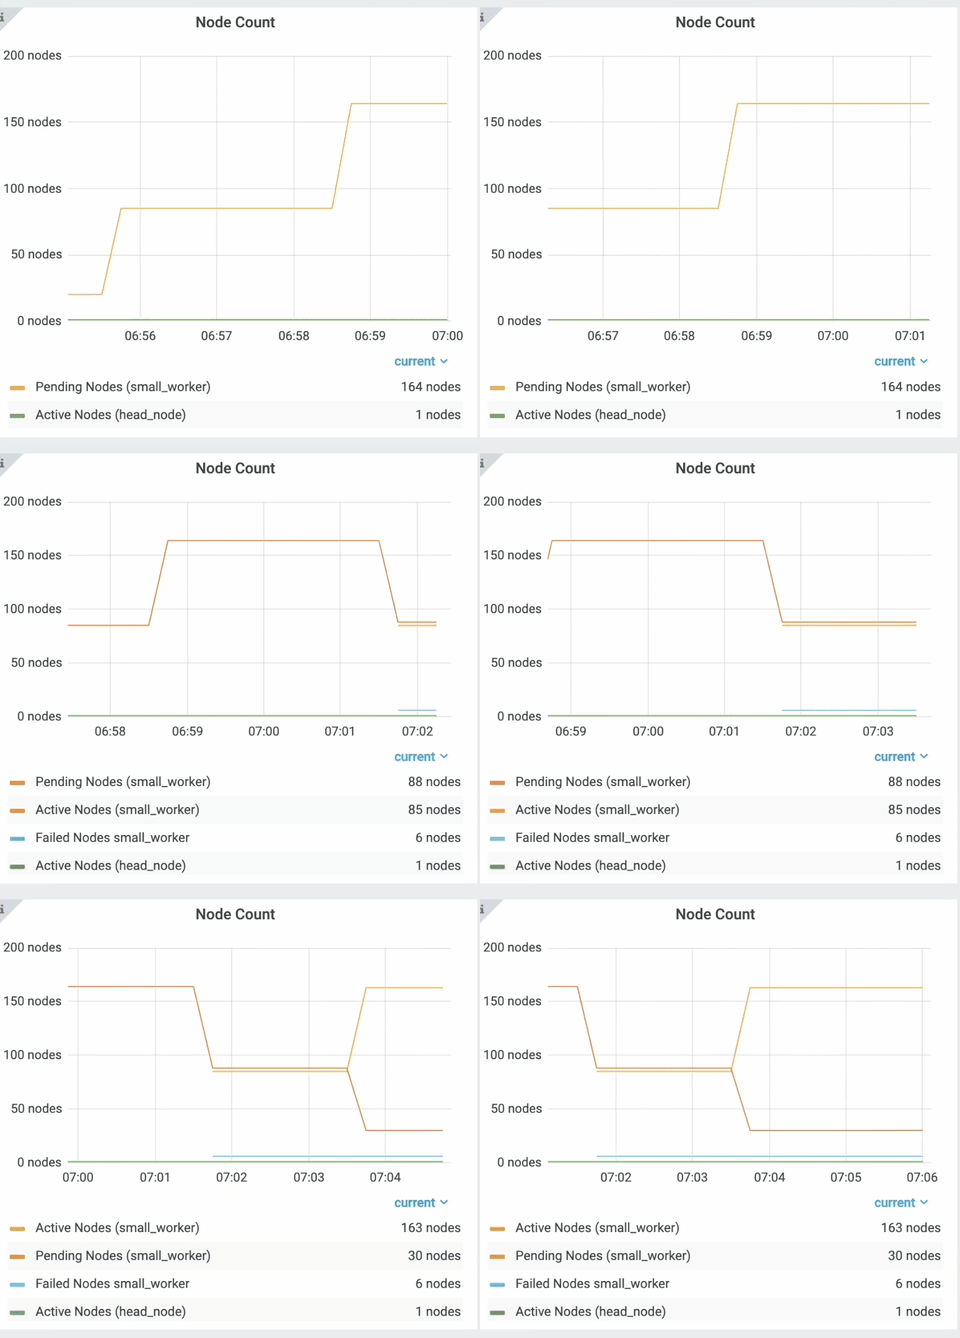 Figure 8. Autoscaling status of nodes while scaling up to 250 nodes
 In the above chart, you can view real time autoscaling status while scaling up from 1 to 250 nodes. The number of active worker nodes labeled as “small_worker” increases over time, and some of the “small_worker” nodes that failed to . To find more details, you can use ray status.
LinkViewing in Grafana
You can go directly to your grafana UI to explore your prometheus data and create new dashboards. The "View in Grafana" button within the Metrics tab takes you directly to Grafana, where you can view and edit the raw charts directly.
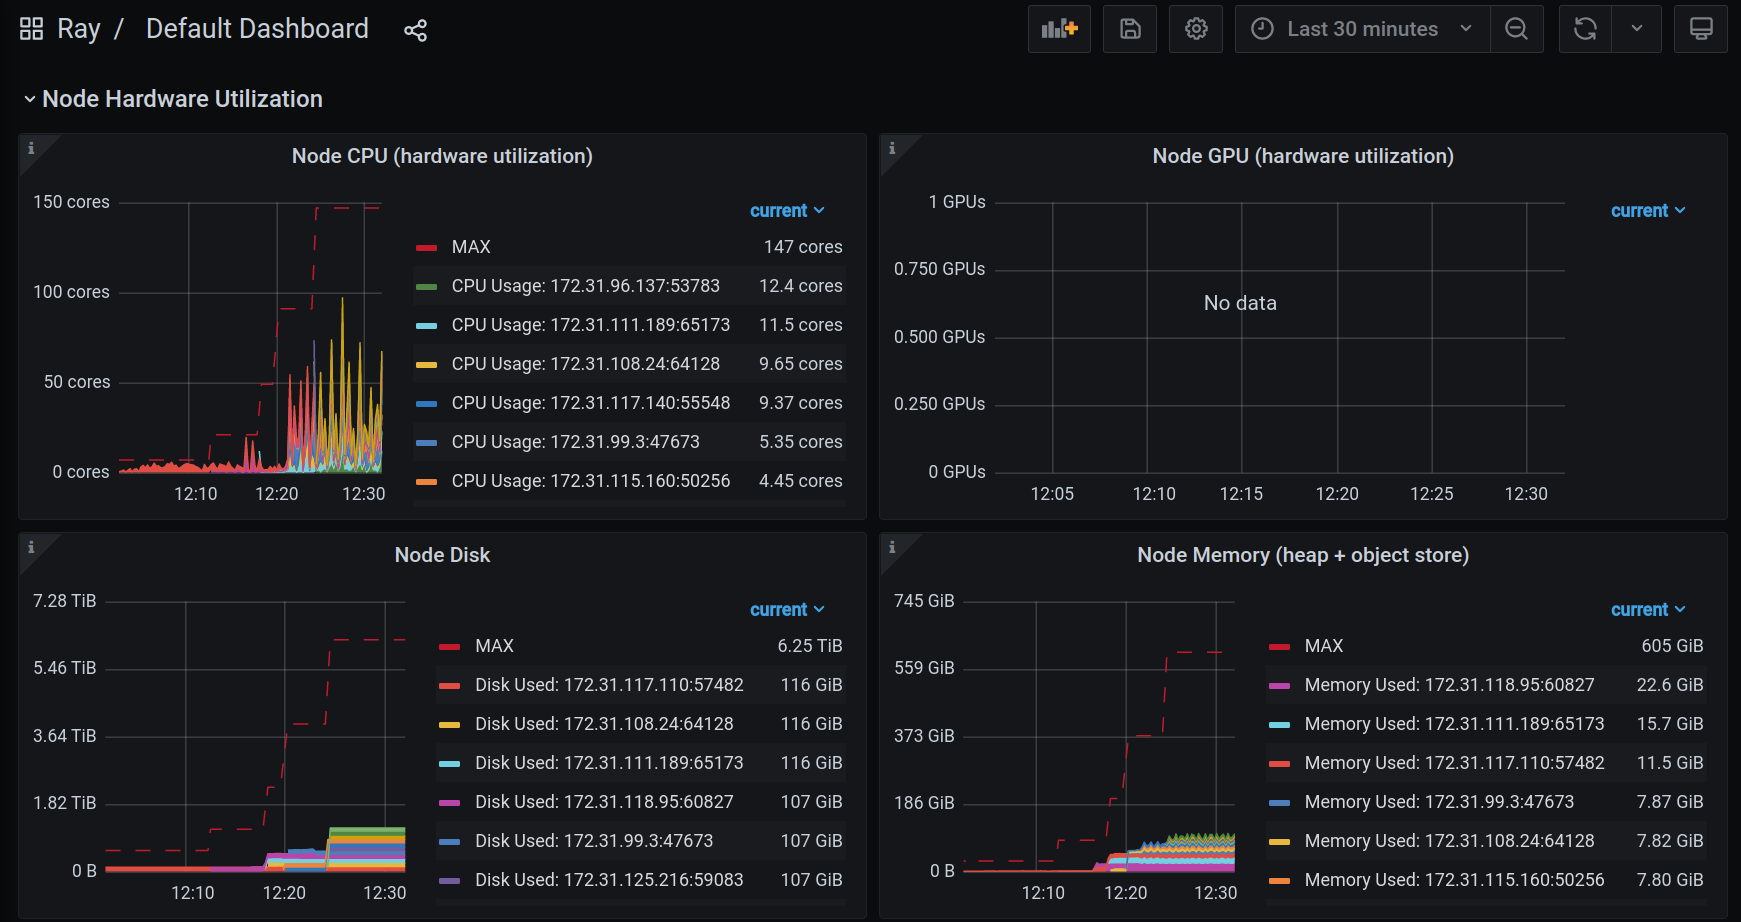 Figure 9. Grafana display of metrics
LinkConclusion
To sum up, monitoring and debugging Ray production workloads is a necessity. To address this observability imperative, the Ray 2.1 release extends the dashboard to display time series metrics from numerous Ray cluster activities, including tasks, objects, logical and physical resource utilization, and autoscaling status.
Additionally, the new functionality provides easy integration into a popular monitoring system, Prometheus, and a default visualization with the Grafana dashboard.
LinkWhat’s Next
Please view this link for the roadmap for the dashboard. We appreciate any feedback you have for us to improve or enhance functionality. You can provide your constructive feedback via the channels described below or contribute to enhancing both the display and collection of time series metrics.
LinkFeedback
With all these new features and upcoming changes, we would appreciate your feedback. Please message us in the ray slack in the #dashboard or #observability channel or in the dashboard forum at https://discuss.ray.io/c/dashboard/9
LinkContributing
You can use the Grafana UI directly to quickly modify the visualizations. See here for more information on how to edit a Grafana dashboard. After configuring the dashboard, you can view the new Grafana JSON model to update grafana_dashboard_factory.py.


