Streamline Distributed AI Monitoring and Debugging with New Ray Train & Ray Data Dashboards in Anyscale
Ray Train and Ray Data help ML engineers focus on their model training and data processing logic by offering familiar, high-level APIs on top of Ray’s distributed compute engine. However, when it comes to observability, logs and metrics are often scattered and not semantically tagged, requiring engineers to manually piece them together to build visualizations. Even after this time-consuming and error-prone effort, most teams still lack a unified interface to monitor overall run status with integrated drill downs to diagnose specific issues like data loading bottlenecks or out-of-memory errors.
To make debugging and performance tuning faster and more intuitive for practitioners scaling out model training and data processing, we're excited to introduce:
New Ray Train Dashboard: The new Ray Train dashboard provides four critical observability features: training progress, error attribution, logs/metrics, and profiling. With the ability to drill down into worker-level behavior and use built-in profiling tools, identifying performance bottlenecks becomes much simpler. For example, Torch training runs can easily be profiled using integrated tools like
dynolog. Learn more.New Ray Data Dashboard: With Tree and DAG views for pipeline drilldowns, operation-level metrics, and dataset-aware log aggregations, ML engineers can more quickly identify bottlenecks and optimize performance for data pipelines – the foundation of AI applications. Learn more.
Both Ray Data and Ray Train logs are automatically persisted in Anyscale – enabling powerful post-mortem analysis even after cluster failures (e.g., out-of-memory errors). Debugging without reruns to reproduce the error or having to keep expensive clusters running is just one of the many benefits. Persistent logs also make it easy to evaluate trends over time and spot slow or inefficient stages across multiple runs, helping you identify optimization opportunities.
LinkRay Train Dashboard: Unified Observability for Distributed Training
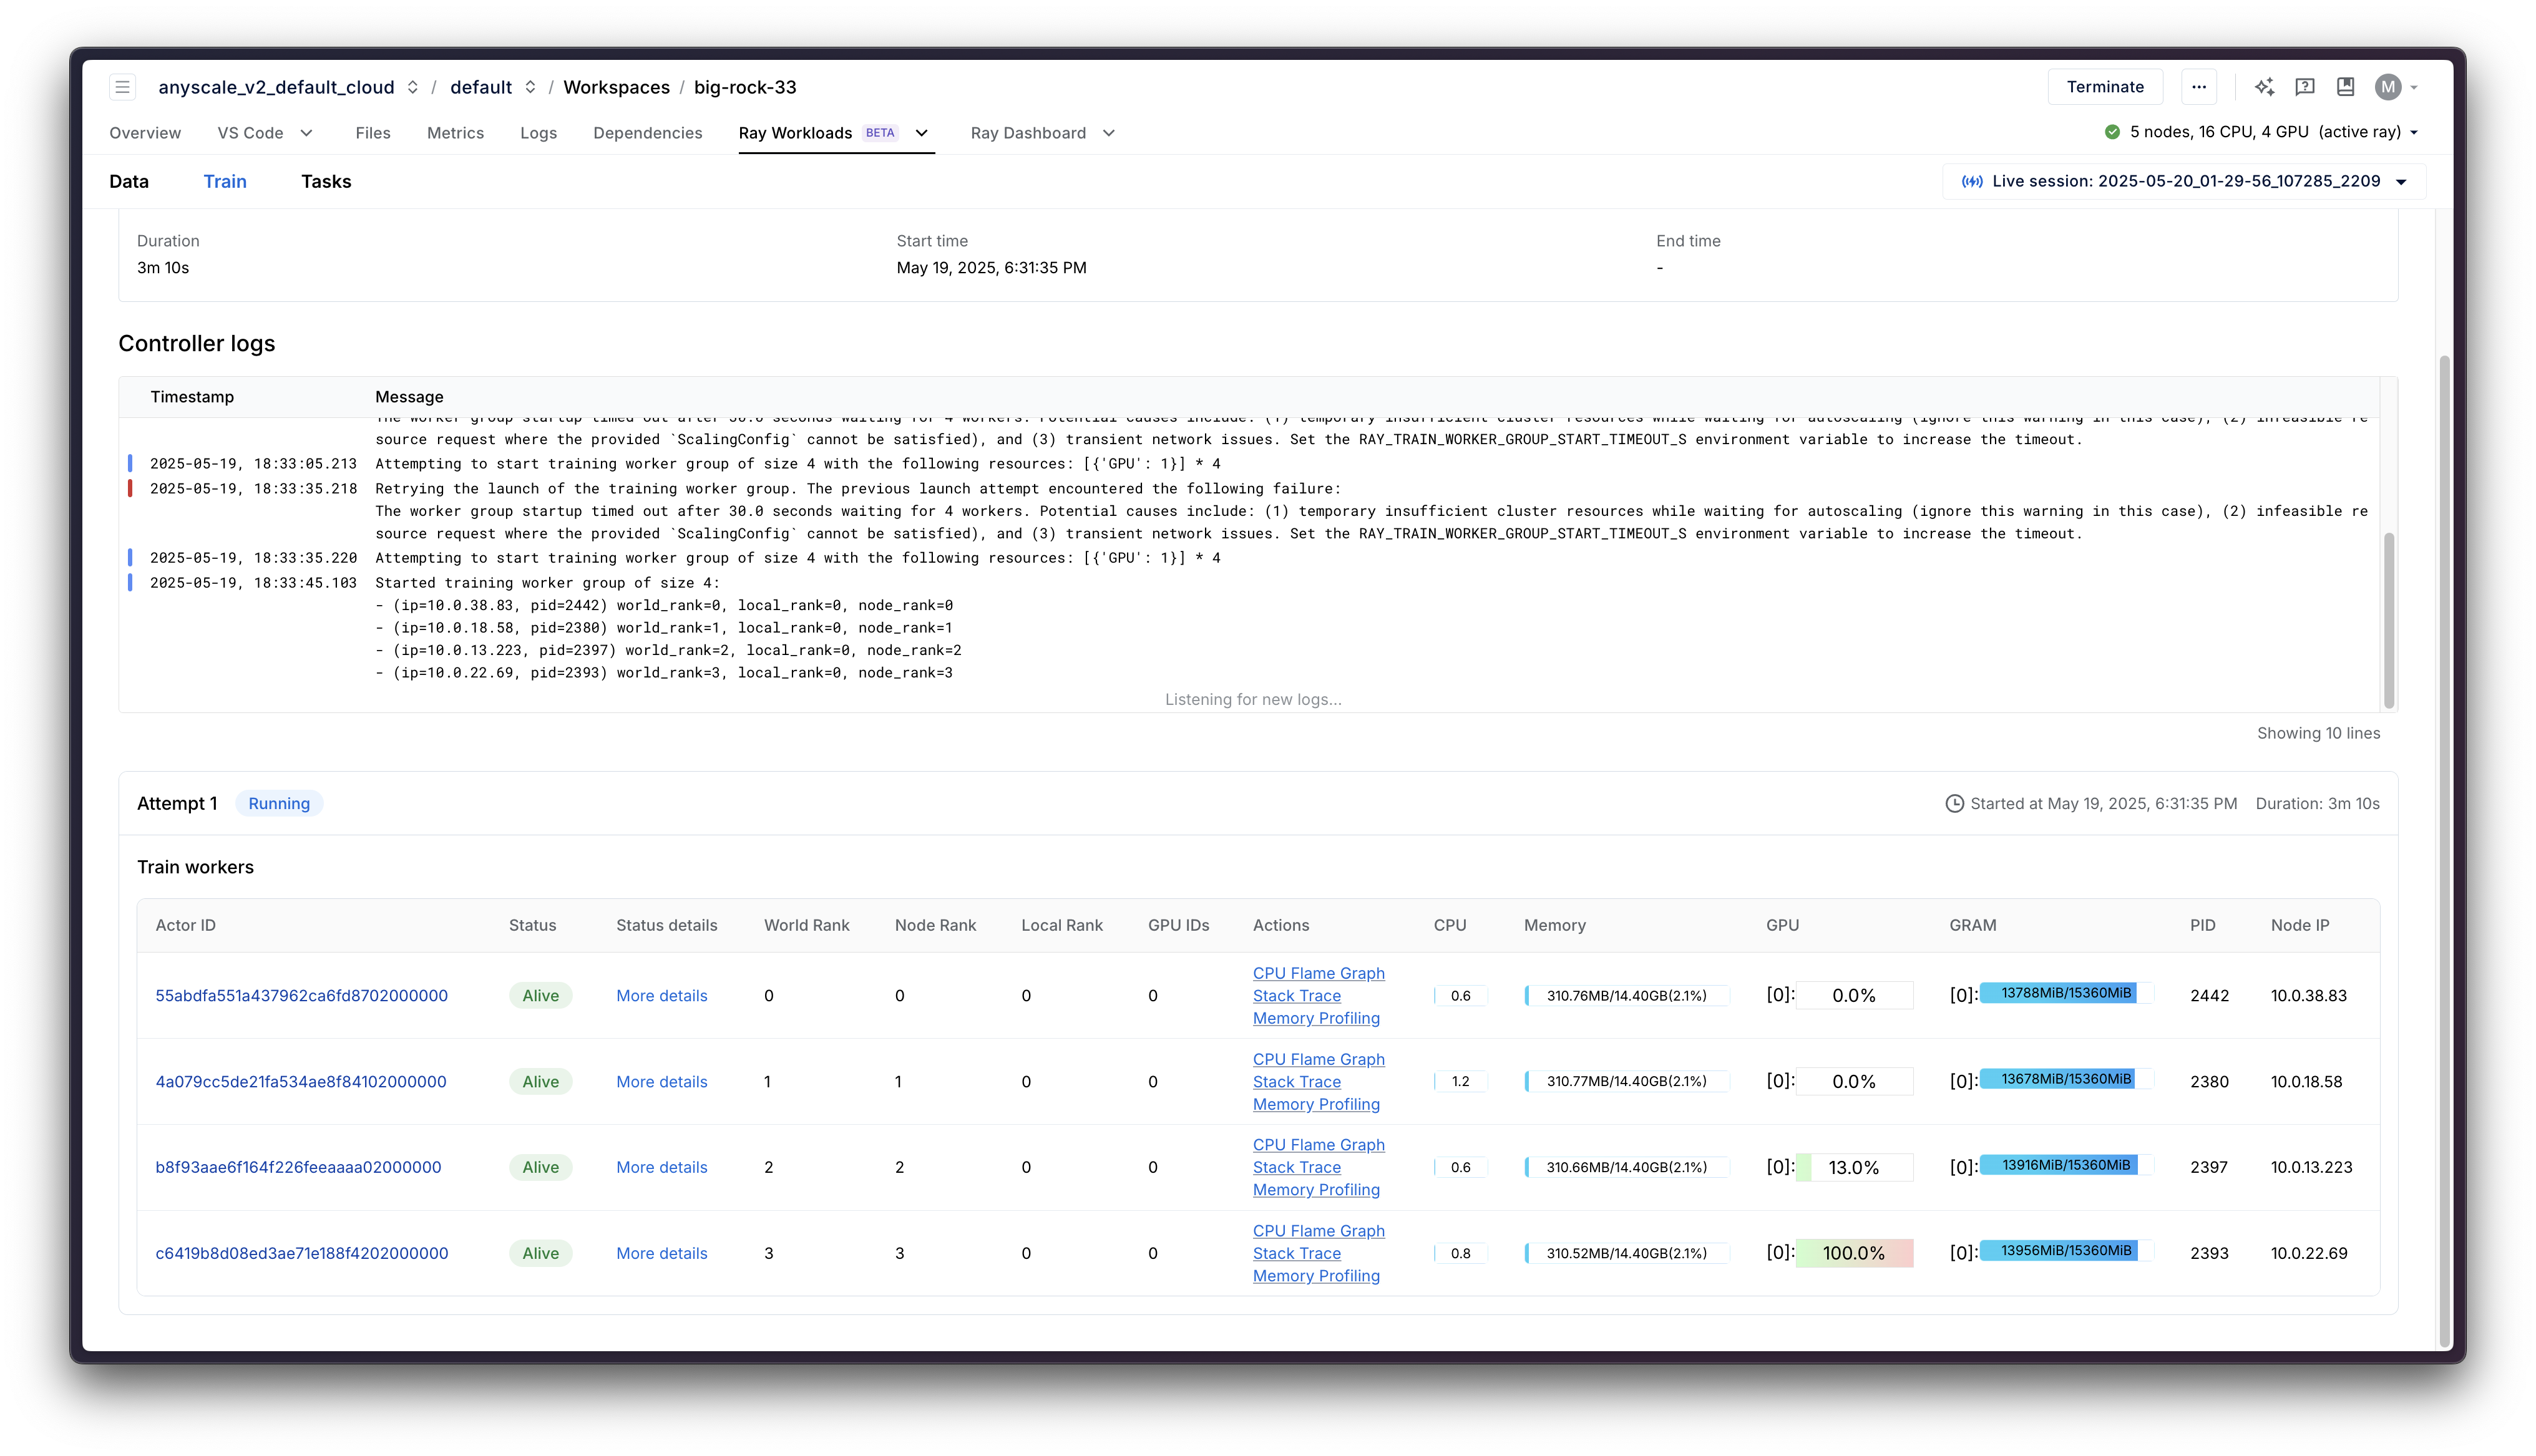
Fig 1. Distributed AI Training Observability with Ray Train Dashboard
Scaling model training with a distributed framework like Ray introduces significant complexity, particularly when monitoring the job in progress and debugging failures. Today, practitioners need to manually assemble logs, metrics, and context scattered across various nodes to understand what went wrong, a process that becomes increasingly cumbersome as the number of workers and nodes increases.
The new Ray Train Dashboard in Anyscale addresses these challenges with a comprehensive toolkit for understanding and optimizing distributed training workloads:
Unified experience: A unified interface for accessing logs and metrics
Progress tracking: A clear visualization of training progress and job state
Rich error context: Insights into errors, retries, and fault tolerance behavior
One-click profiling: One-click CPU, GPU, and memory profiling for live training jobs
LinkUnified Interface for Log and Metric Drilldowns
Distributed training environments typically scatter logs and metrics across different systems and interfaces, forcing you to manually correlate information between worker logs, controller outputs, and resource metrics. This context-switching becomes increasingly frustrating and error-prone as your training scales to dozens or hundreds of workers.
The Ray Train Dashboard solves this by providing a unified interface for viewing logs and metrics from both the Train Controller and Worker processes.
Start with the TrainRun page for a high-level view of your job status and performance, then drill down into specific worker pages to investigate process-level or node-level behavior. All relevant information is organized in context, saving you time and reducing the cognitive load of monitoring complex distributed jobs.
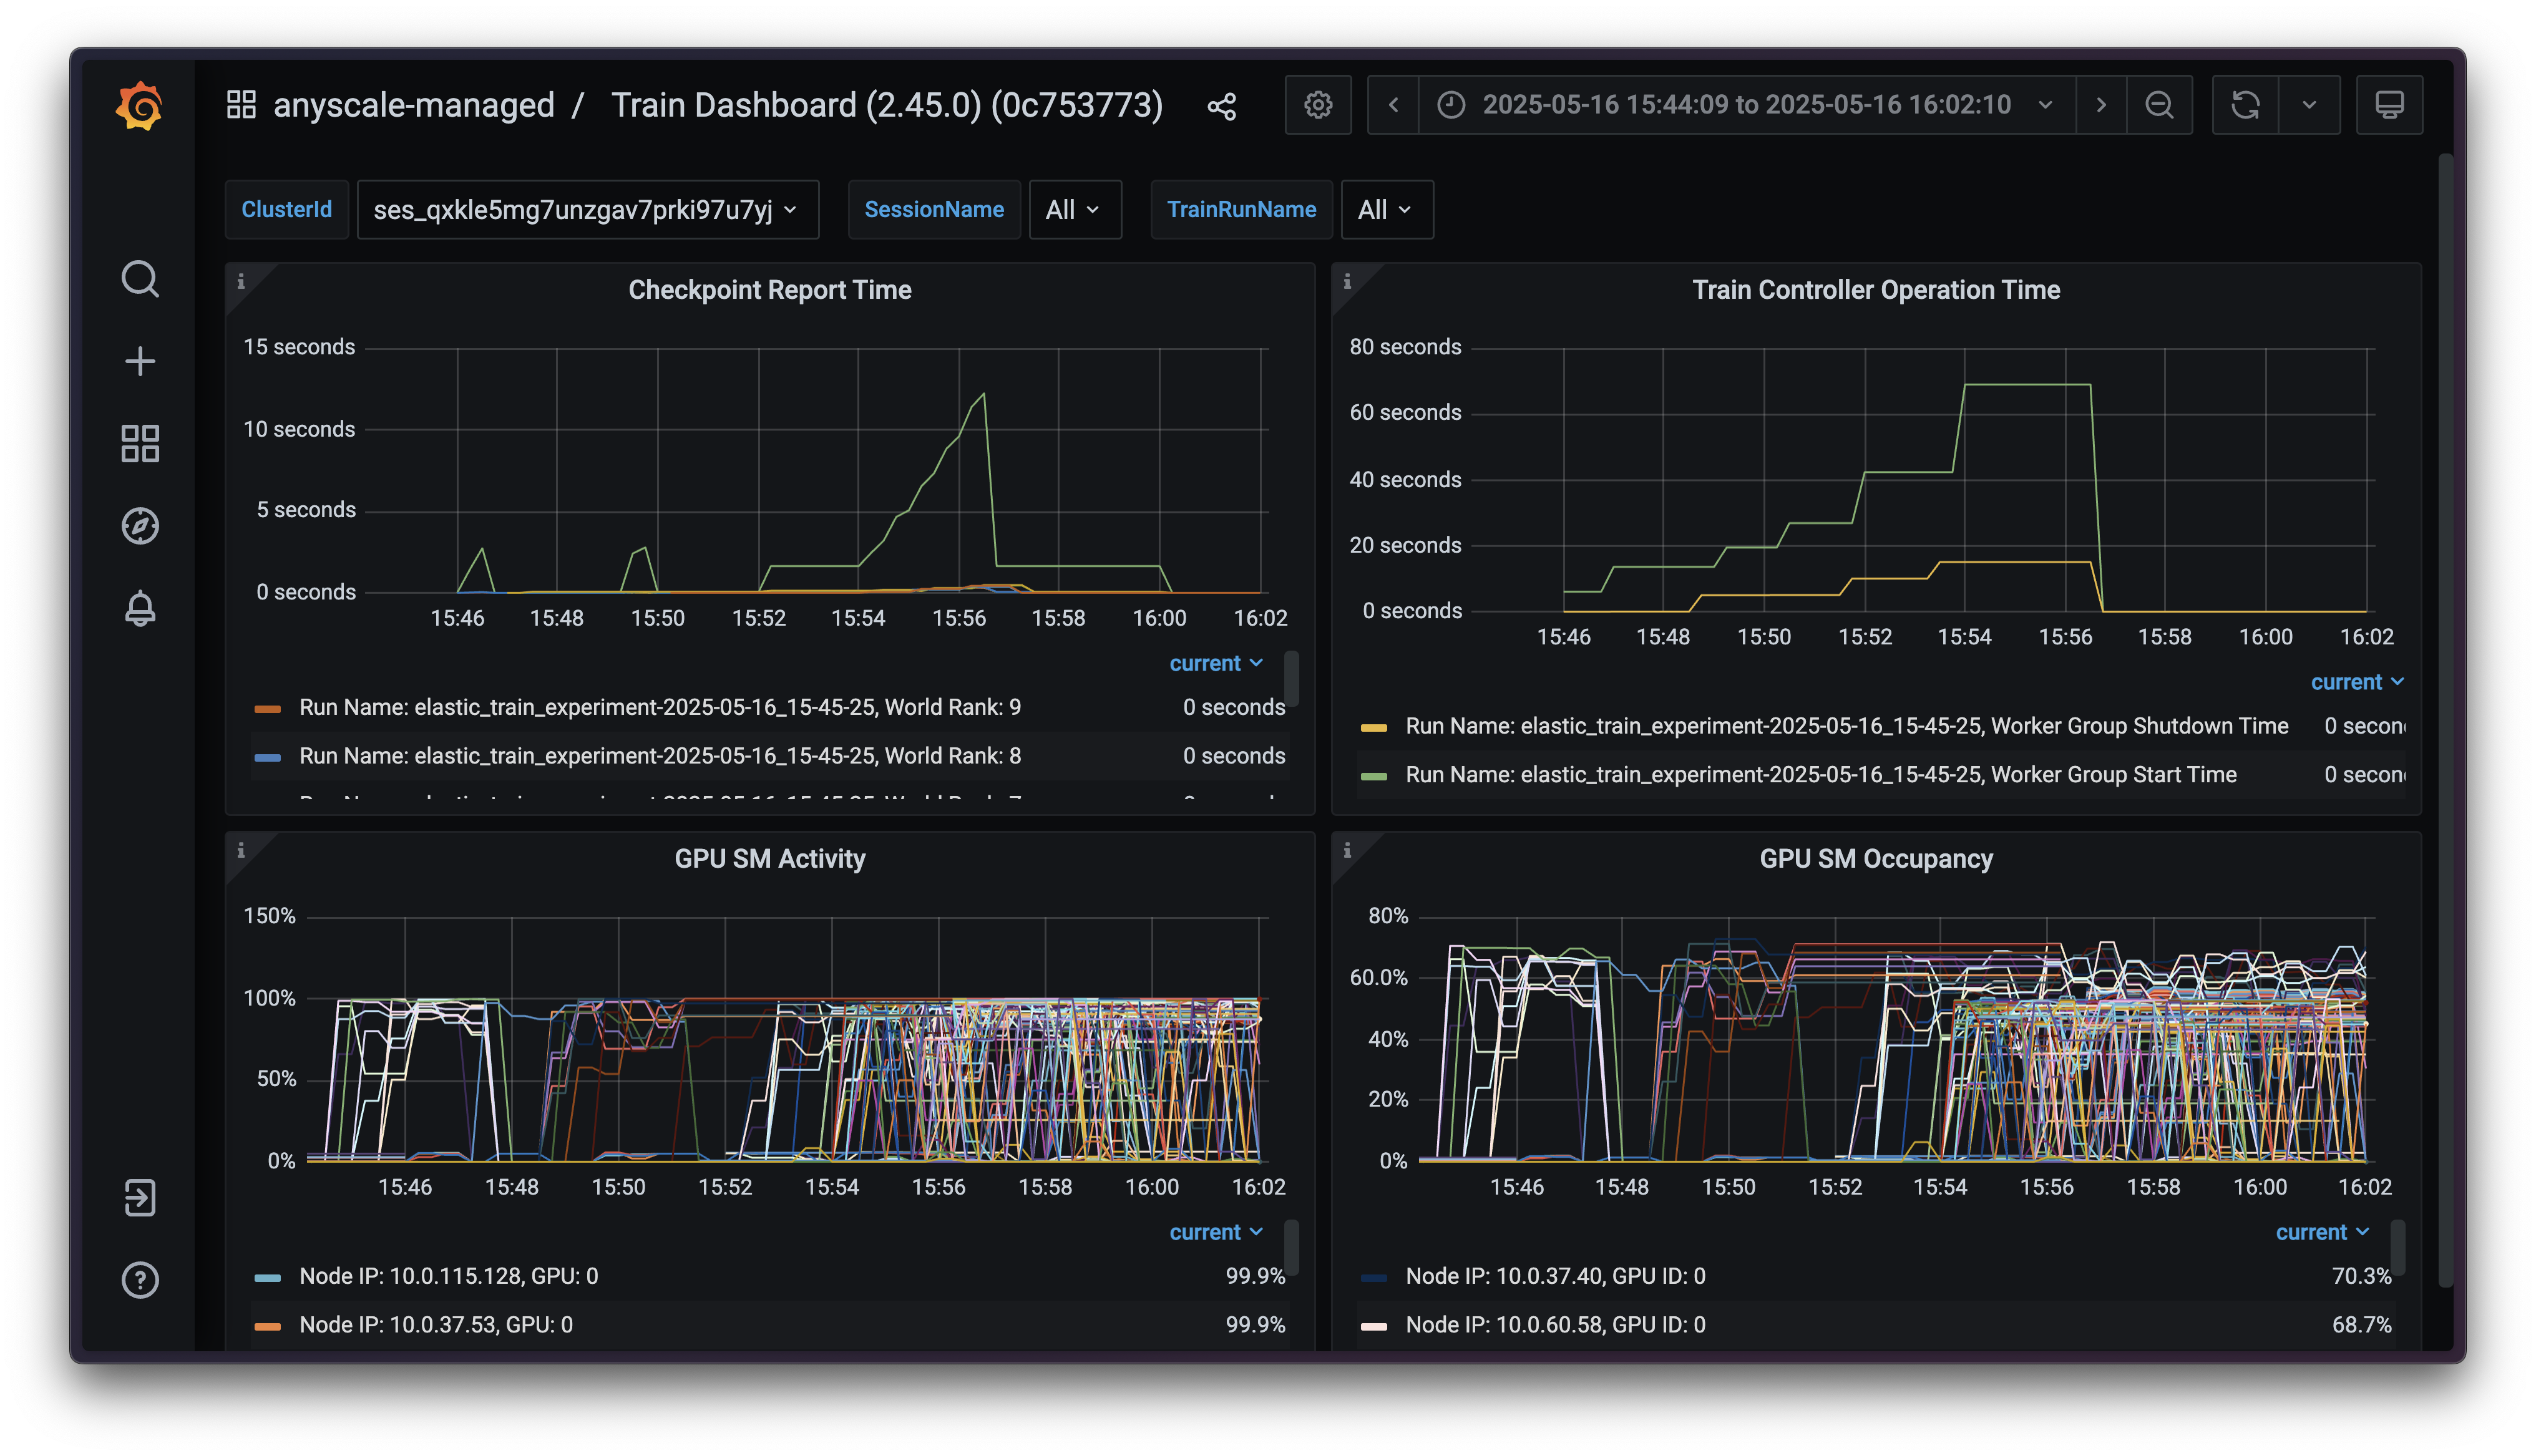
Fig 2. Ray Train Dashboard provides more metrics broken down by controller, worker, and node
LinkClear Visualization of Training Progress and Job State
Ever wondered where your training job is spending its time? The Ray Train Dashboard introduces workload-level abstractions – such as training runs and attempts, in addition to providing immediate visibility into all workers – to help you visualize and understand what's happening in your distributed training jobs at different altitudes.
From the moment you launch a training job, you can monitor resource requests, scheduling behavior, and utilization patterns. Instead of guessing what's happening inside your training cluster, you get a clear view of execution progress and system performance throughout the entire job lifecycle.
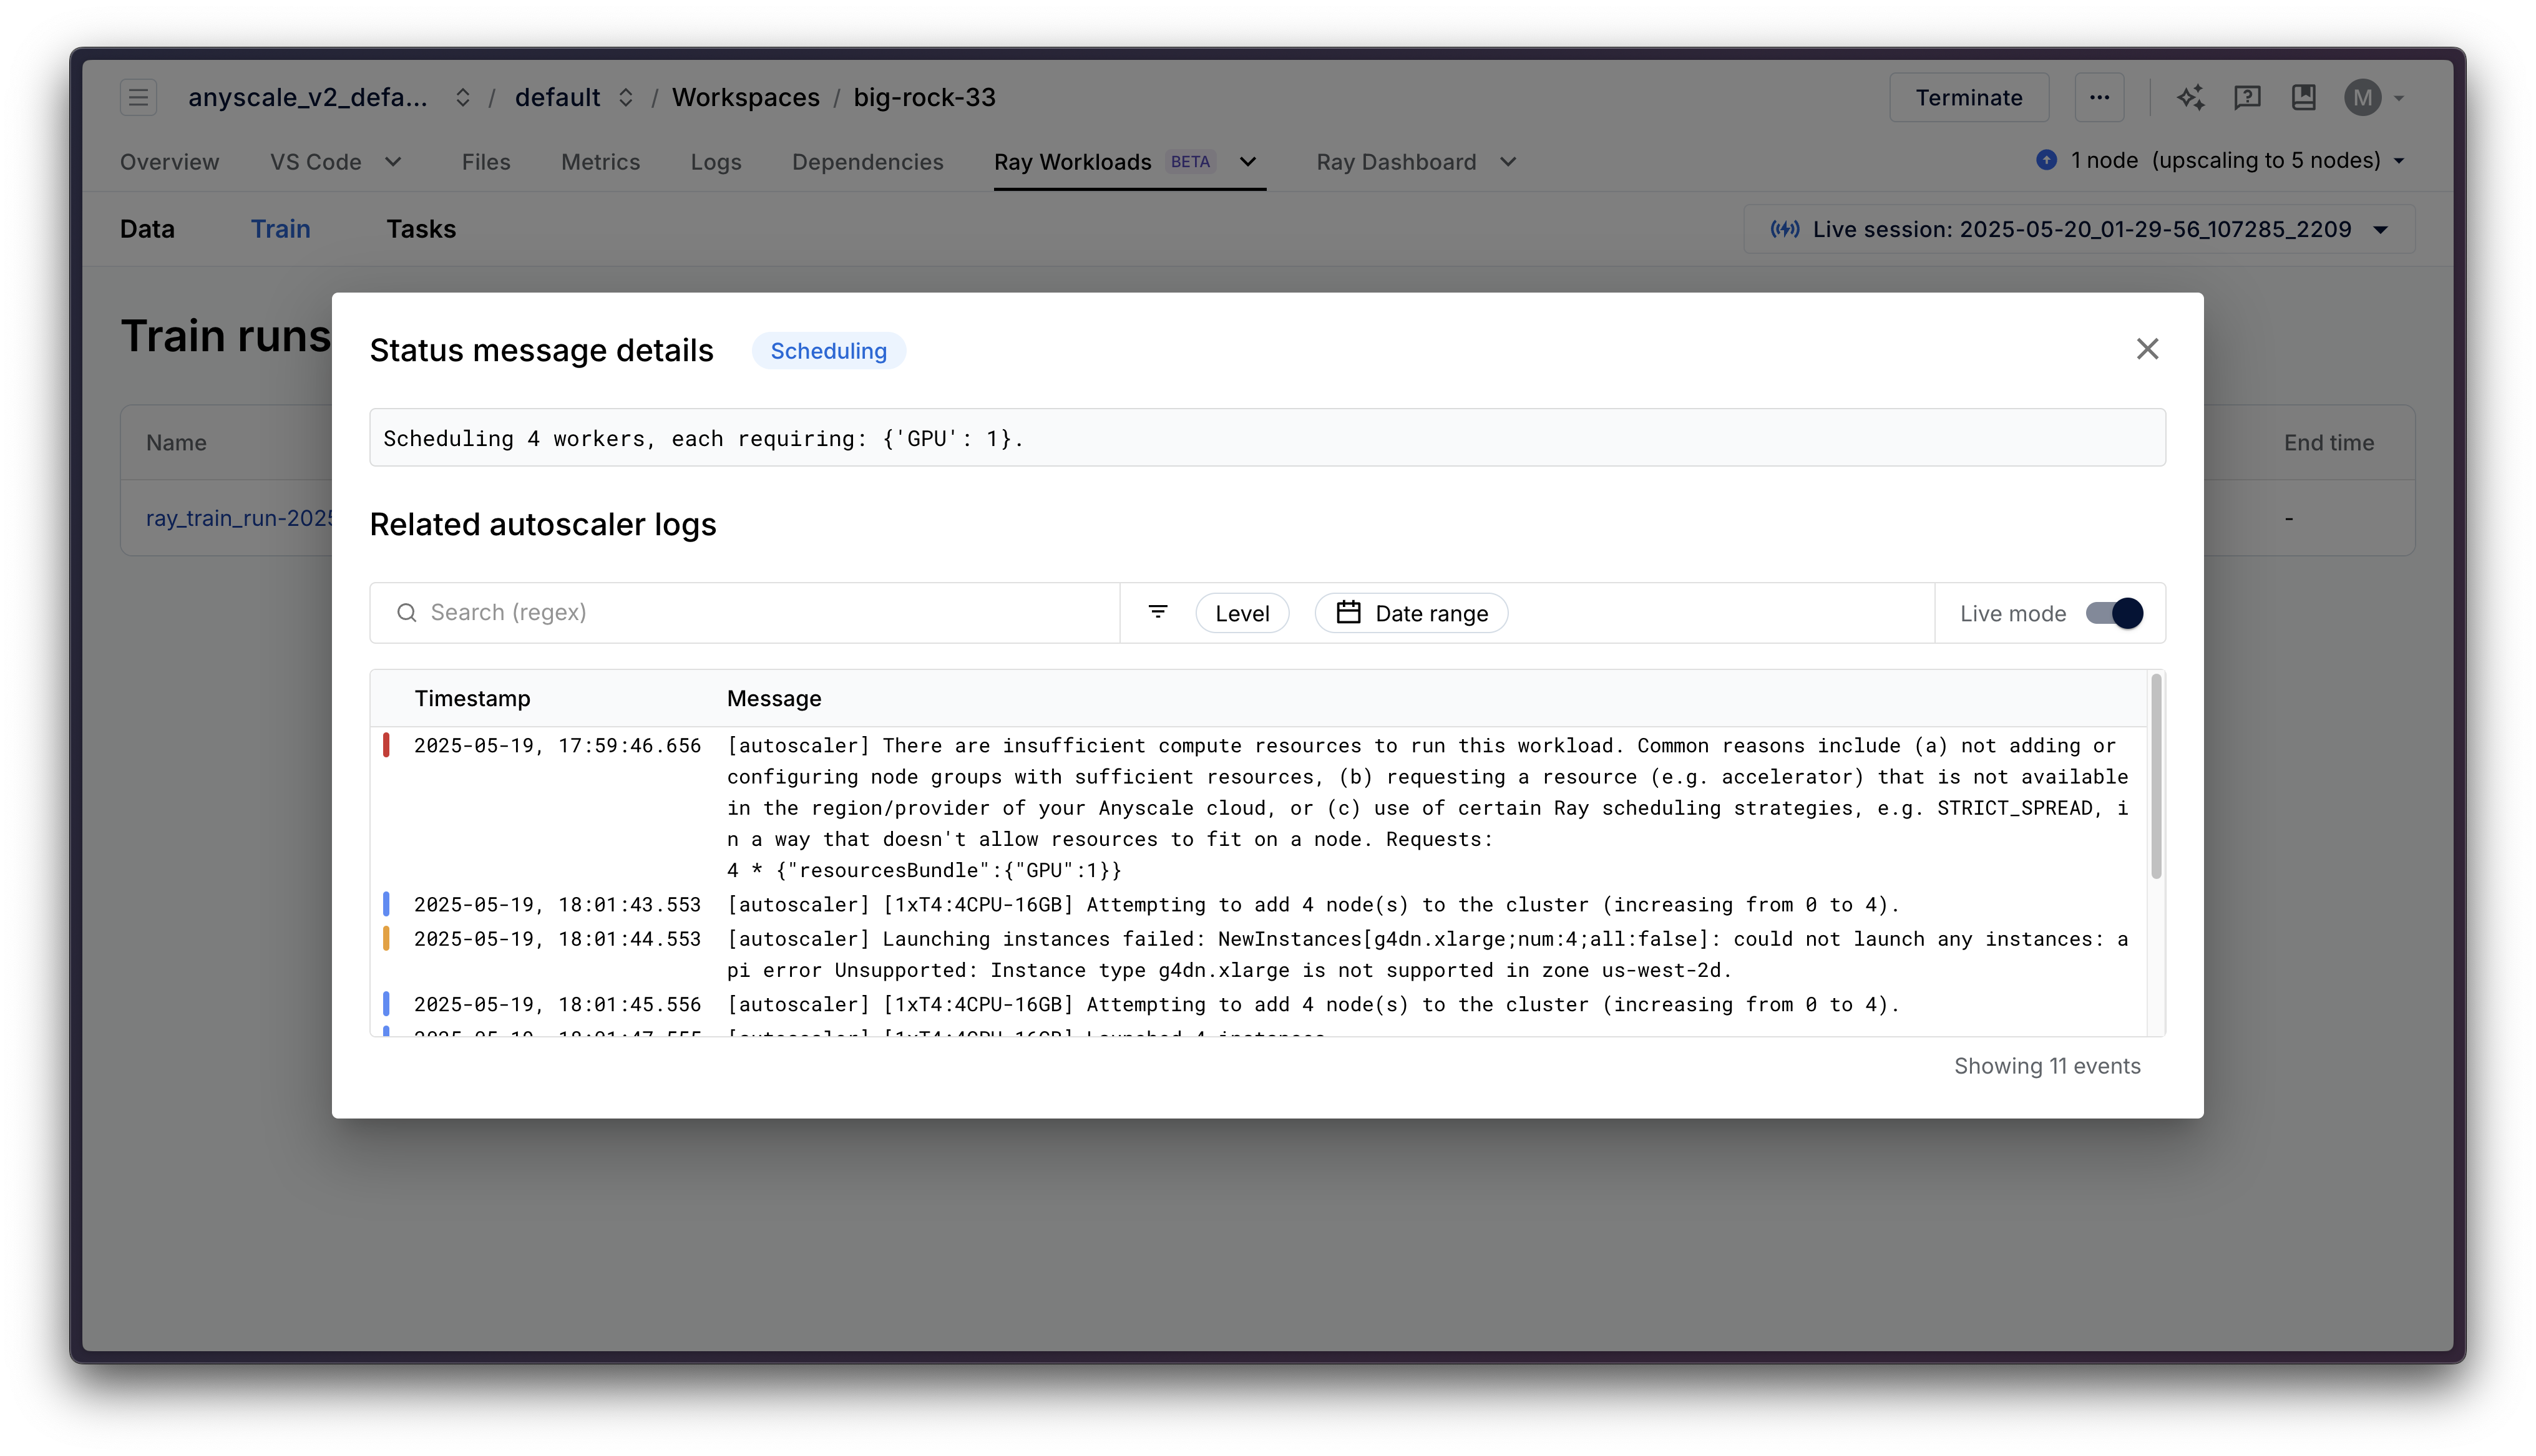
Fig 3. Ray Train Dashboard provides contextual information based on its stage. In this example, the train run has requested 4 GPUs, and the dashboard will present relevant autoscaling information.
LinkDetailed Error Context When Things Go Wrong
Failures in distributed training are inevitable, but diagnosing them shouldn't be painful. The Ray Train Dashboard provides rich context around failures, helping you quickly understand and address the root cause.
When a training job fails, you get detailed information about:
The specific worker(s) affected
Whether it's an application error or hardware issue
Relevant logs and metrics across the entire stack
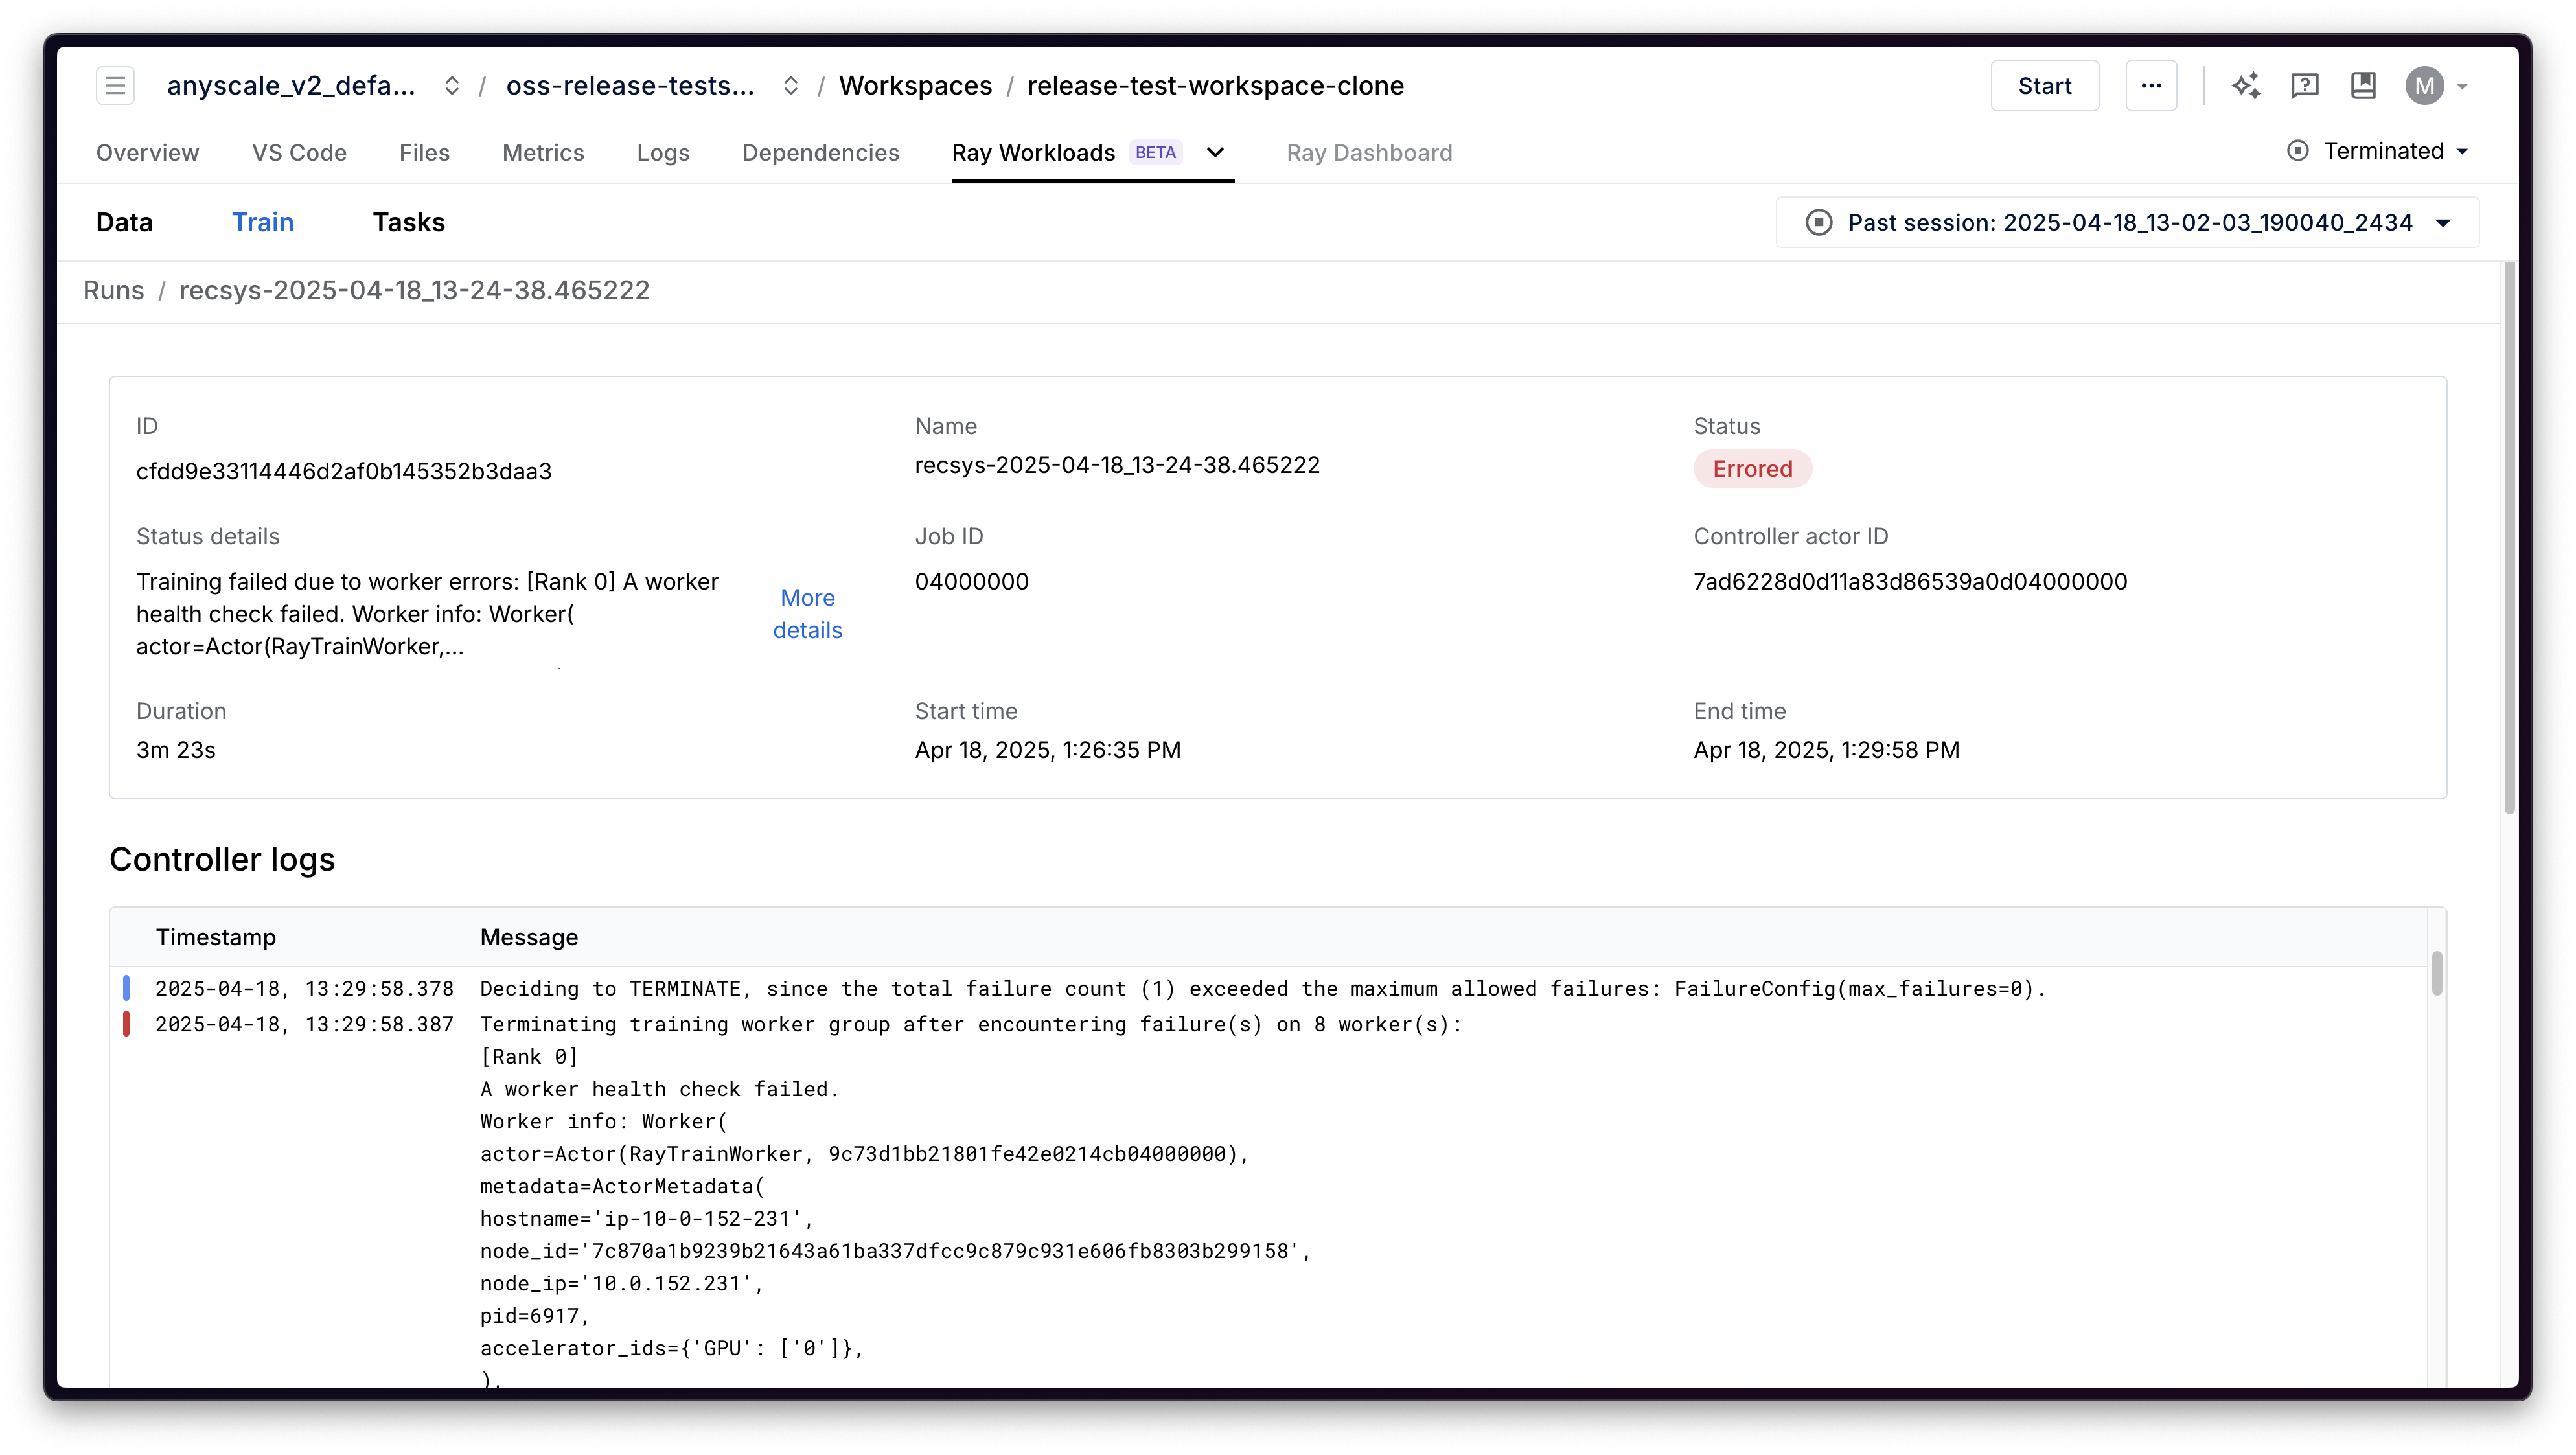
Fig 4. When a failure occurs, the train run will be marked as Errored and will have status details explaining where the error came from
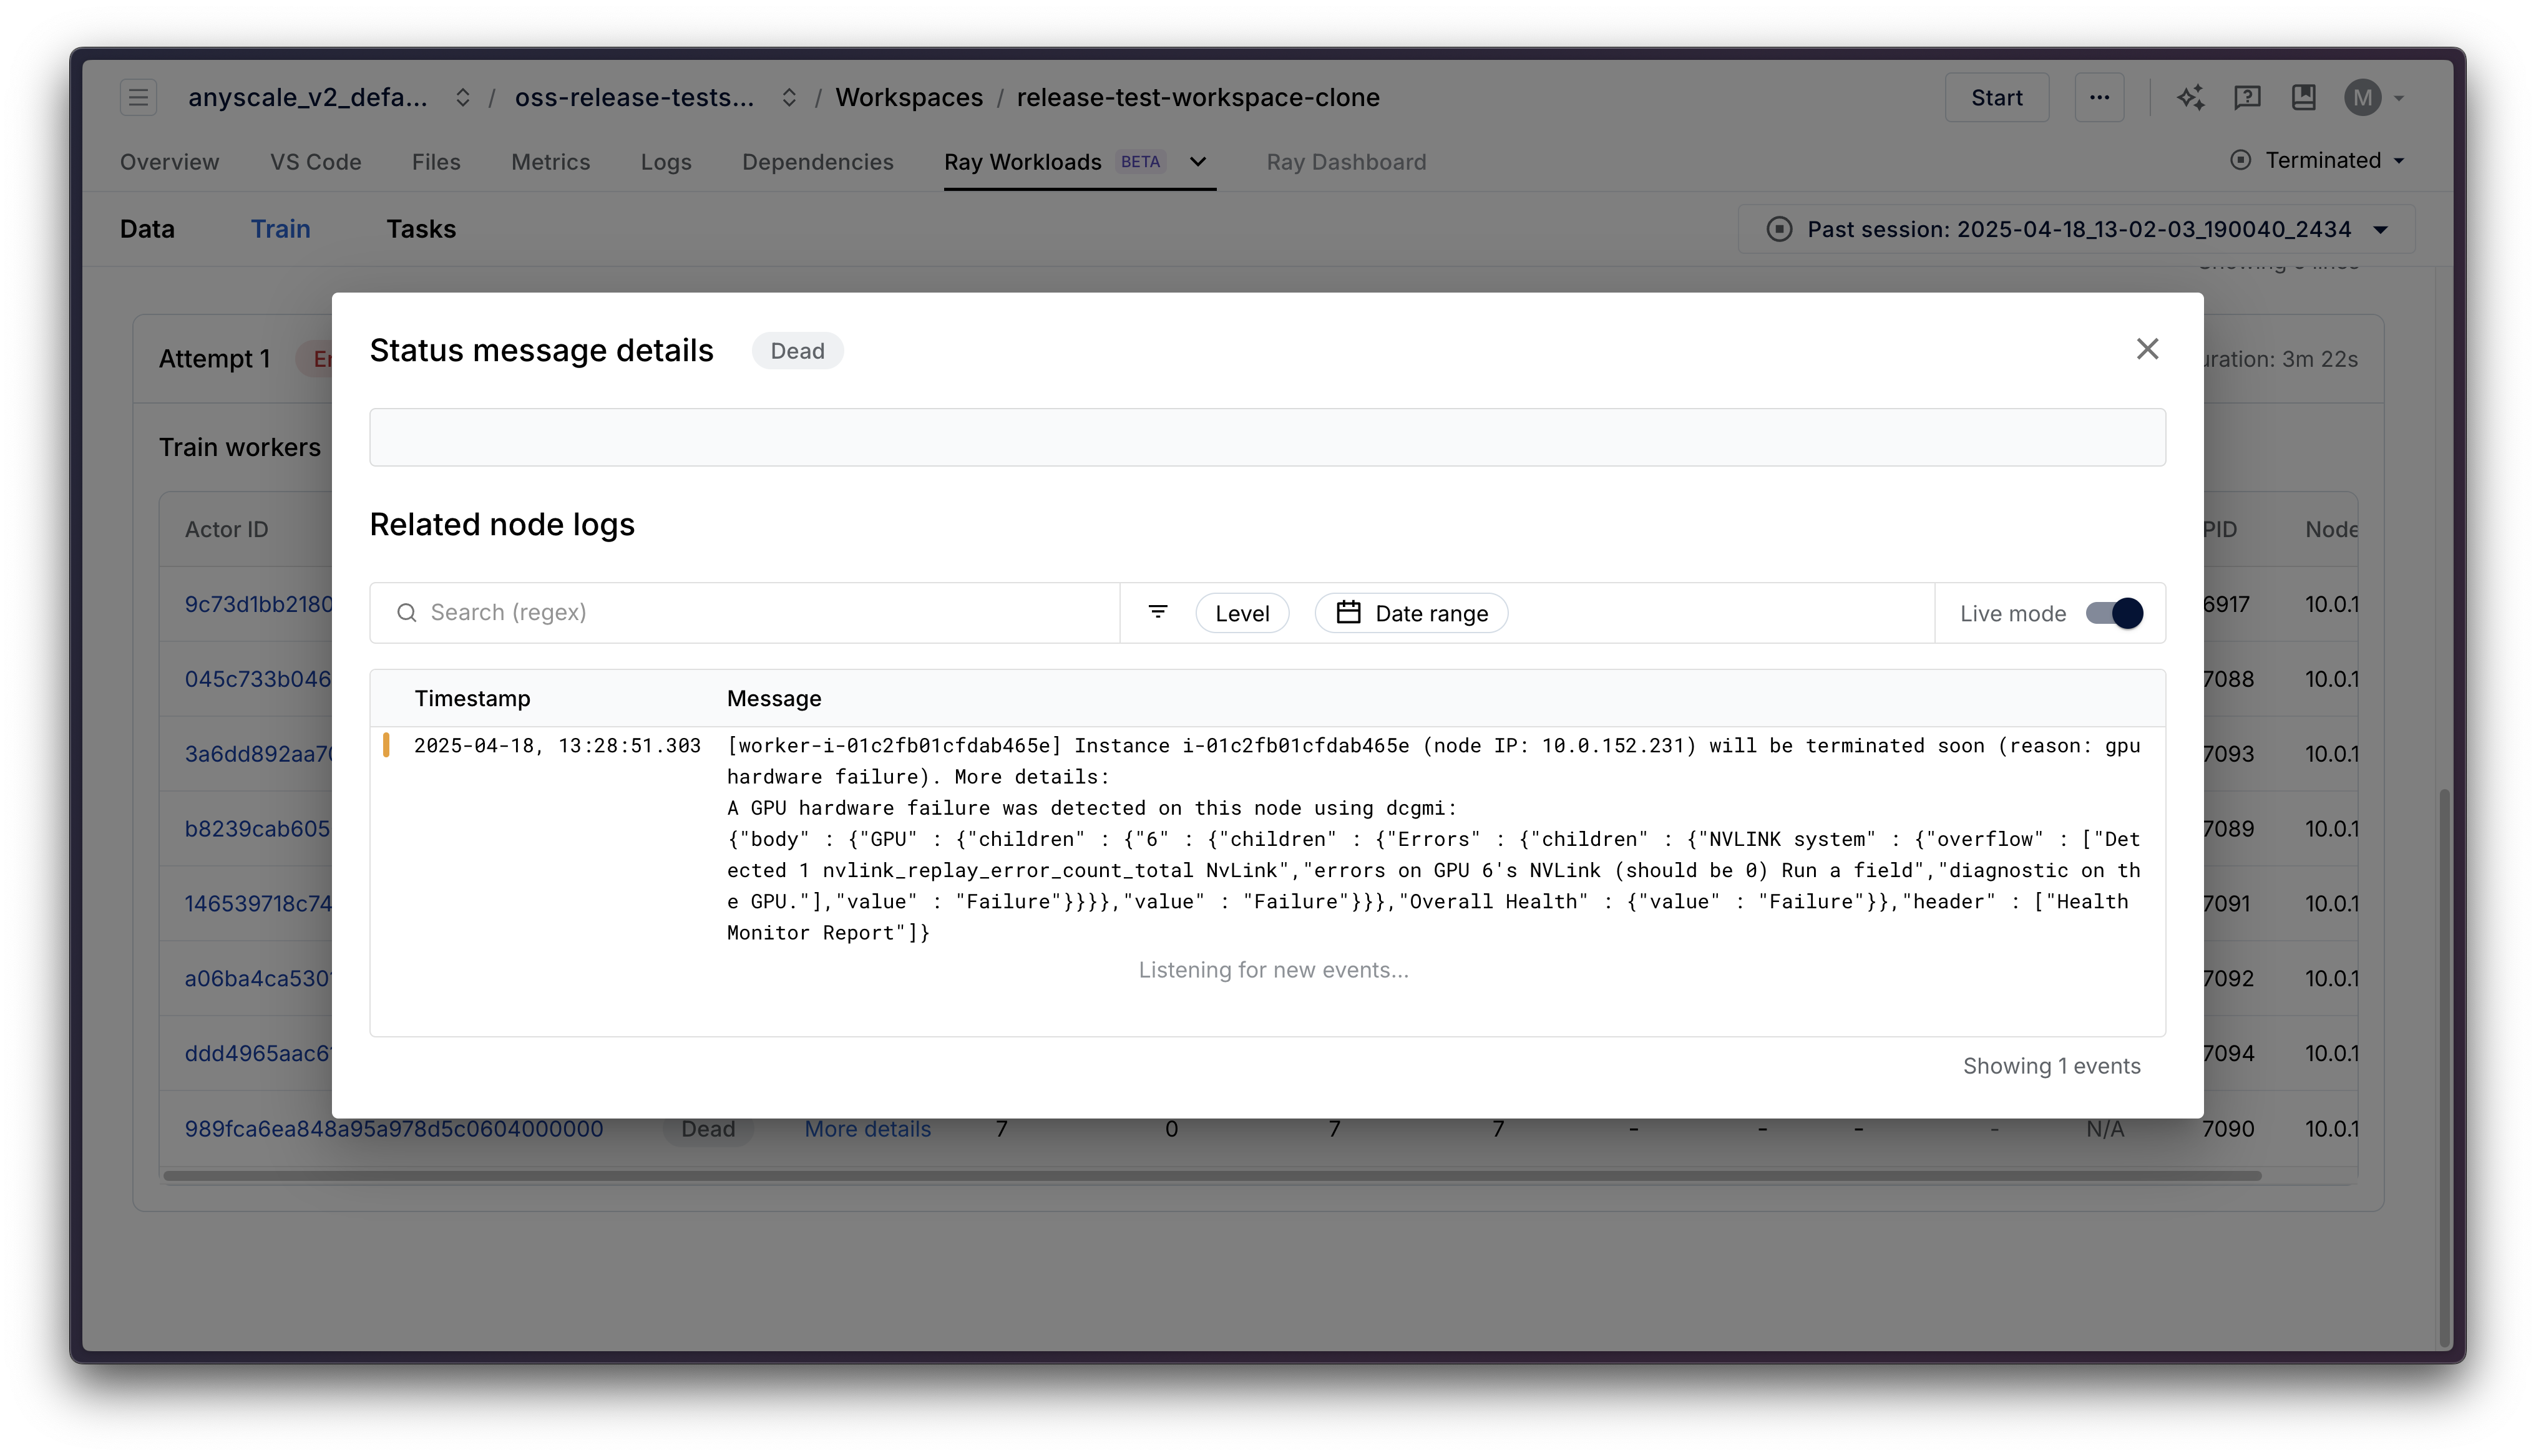
Fig 5. When an error occurs, individual workers will also have status details, including relevant node logs, such as this GPU failure.
If you're using Ray Train's fault tolerance capabilities, or RayTurbo Train's elastic training capabilities, the dashboard clearly visualizes the rescheduled training attempts and allows you to inspect the historical retries, making it easy to understand how the system is recovering from failures.
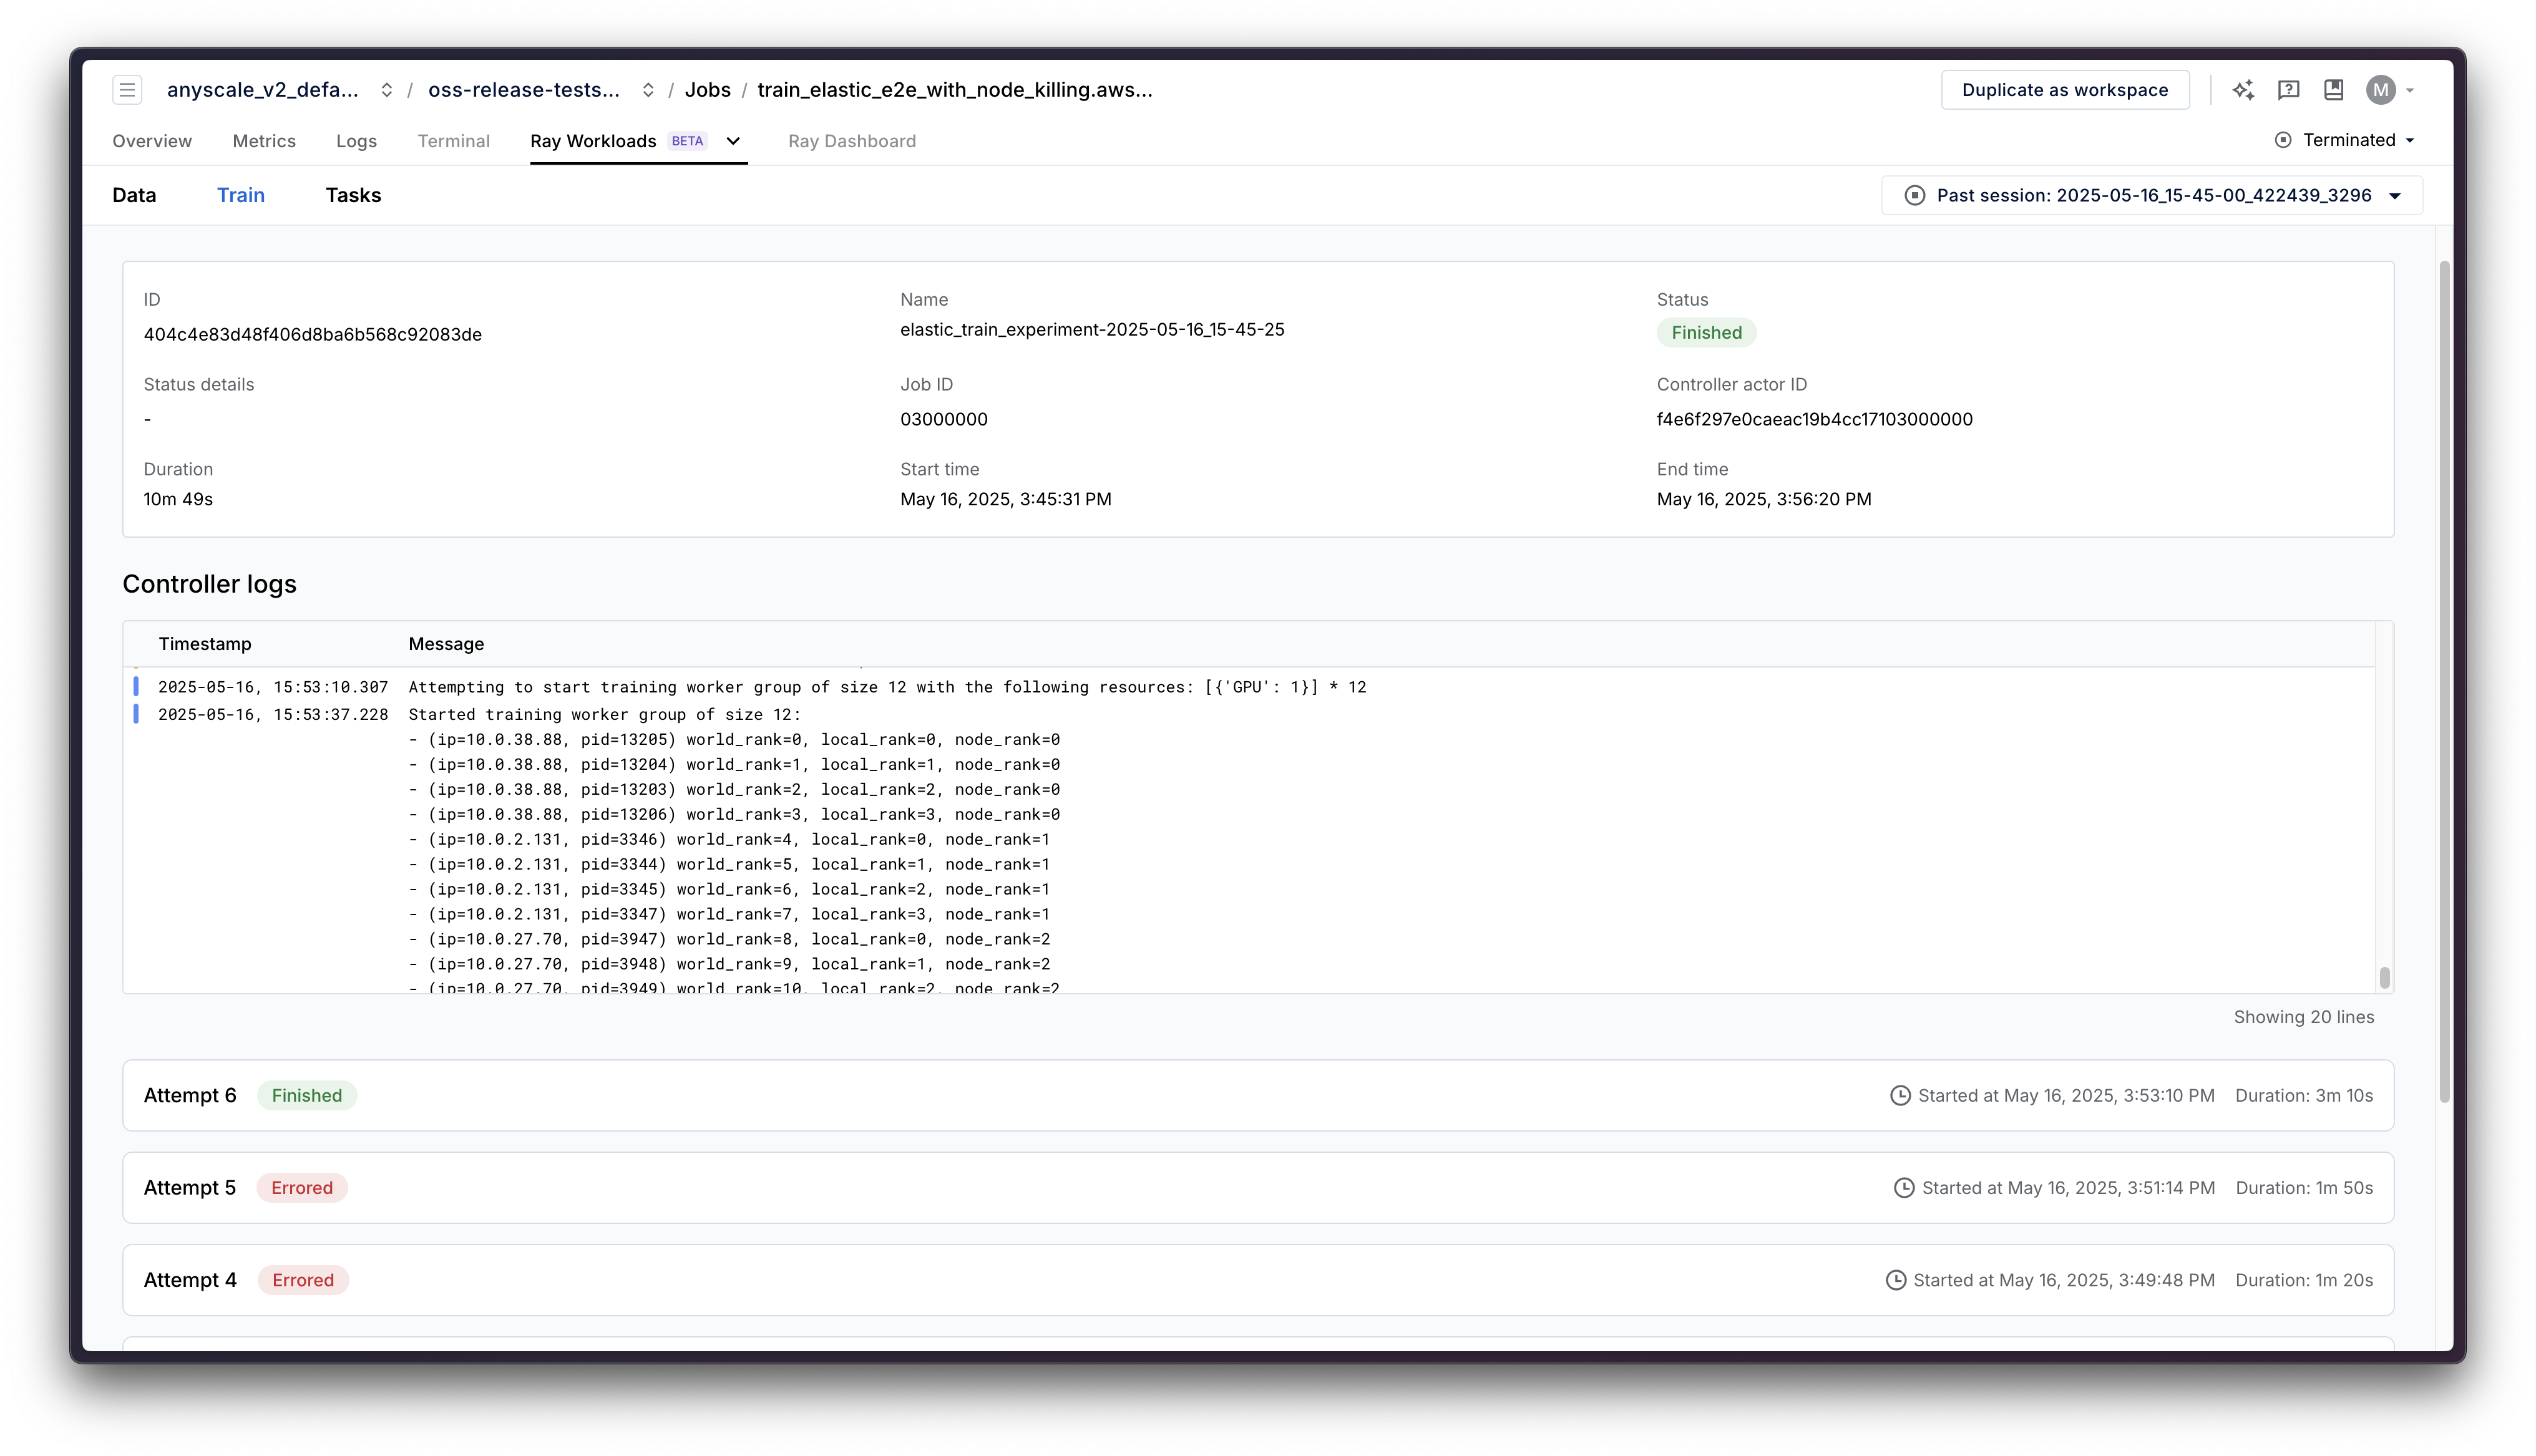
Fig 6. Ray Train breaks down its runs by attempts. In this example, the training run succeeded on its 6th attempt. You can click into the previous 5 attempts to see the root cause for why each attempt failed.
LinkOne-Click Profiling for Performance Optimization
Identifying performance bottlenecks in distributed training has traditionally required deep expertise in both AI frameworks and distributed systems, in addition to knowing how to use multiple, specialized tools.
To make it easier to optimize performance, the Ray Train Dashboard integrates profiling tools like py-spy and dynolog for on-demand performance analysis. With py-spy, users can generate flame graphs and stack traces to identify CPU bottlenecks or hangs. For Torch training runs, dynolog can provide traces showing the full picture of CPU and GPU activity, which can uncover bottlenecks in the training pipeline. These tools can be launched with a single click and enable users to pinpoint areas of optimization across the cluster.

Fig 7. A flamegraph generated by on-demand sampling-based CPU profiling of the training worker process, which can be used to identify bottlenecks. In this example, there's some metric aggregation logic that is taking up a large percentage of the CPU time.
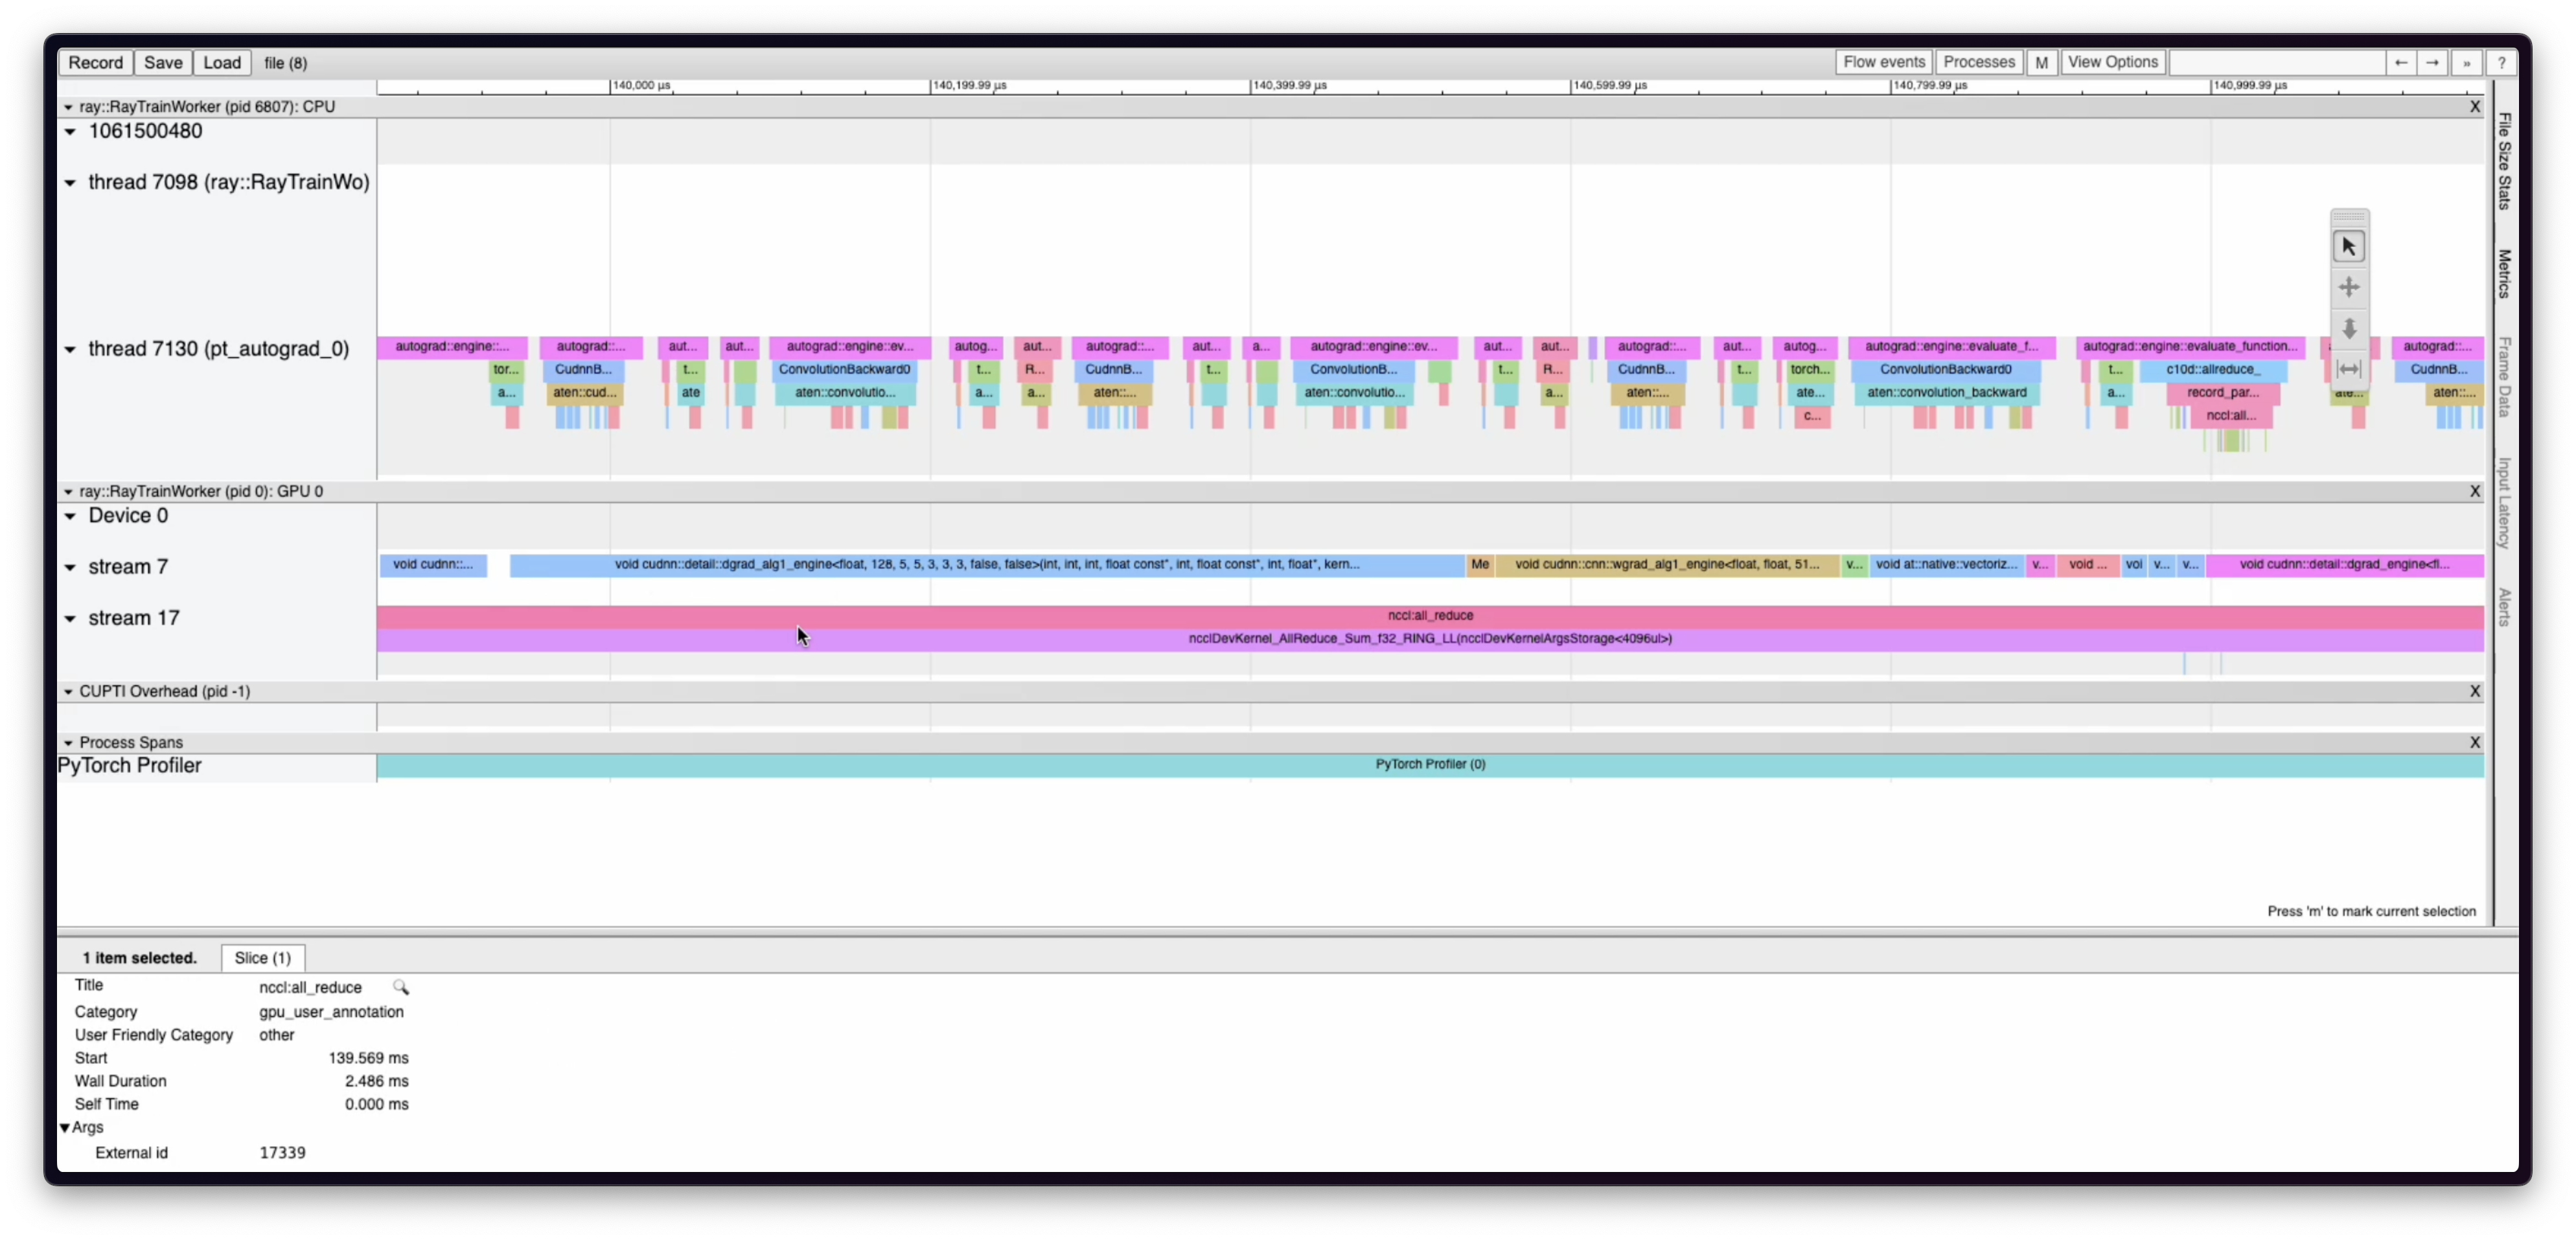
Fig 8. A trace visualization generated from on-demand GPU profiling on Anyscale. This trace can help identify bottlenecks on both the CPU and GPU sides by showing a timeline of CPU operations and GPU kernels. The picture above zooms in on a collective all-reduce operation which is part of the Distributed Data Parallel algorithm for distributed training
LinkRay Data Dashboard: Faster Pipeline Debugging with Tree and DAG views
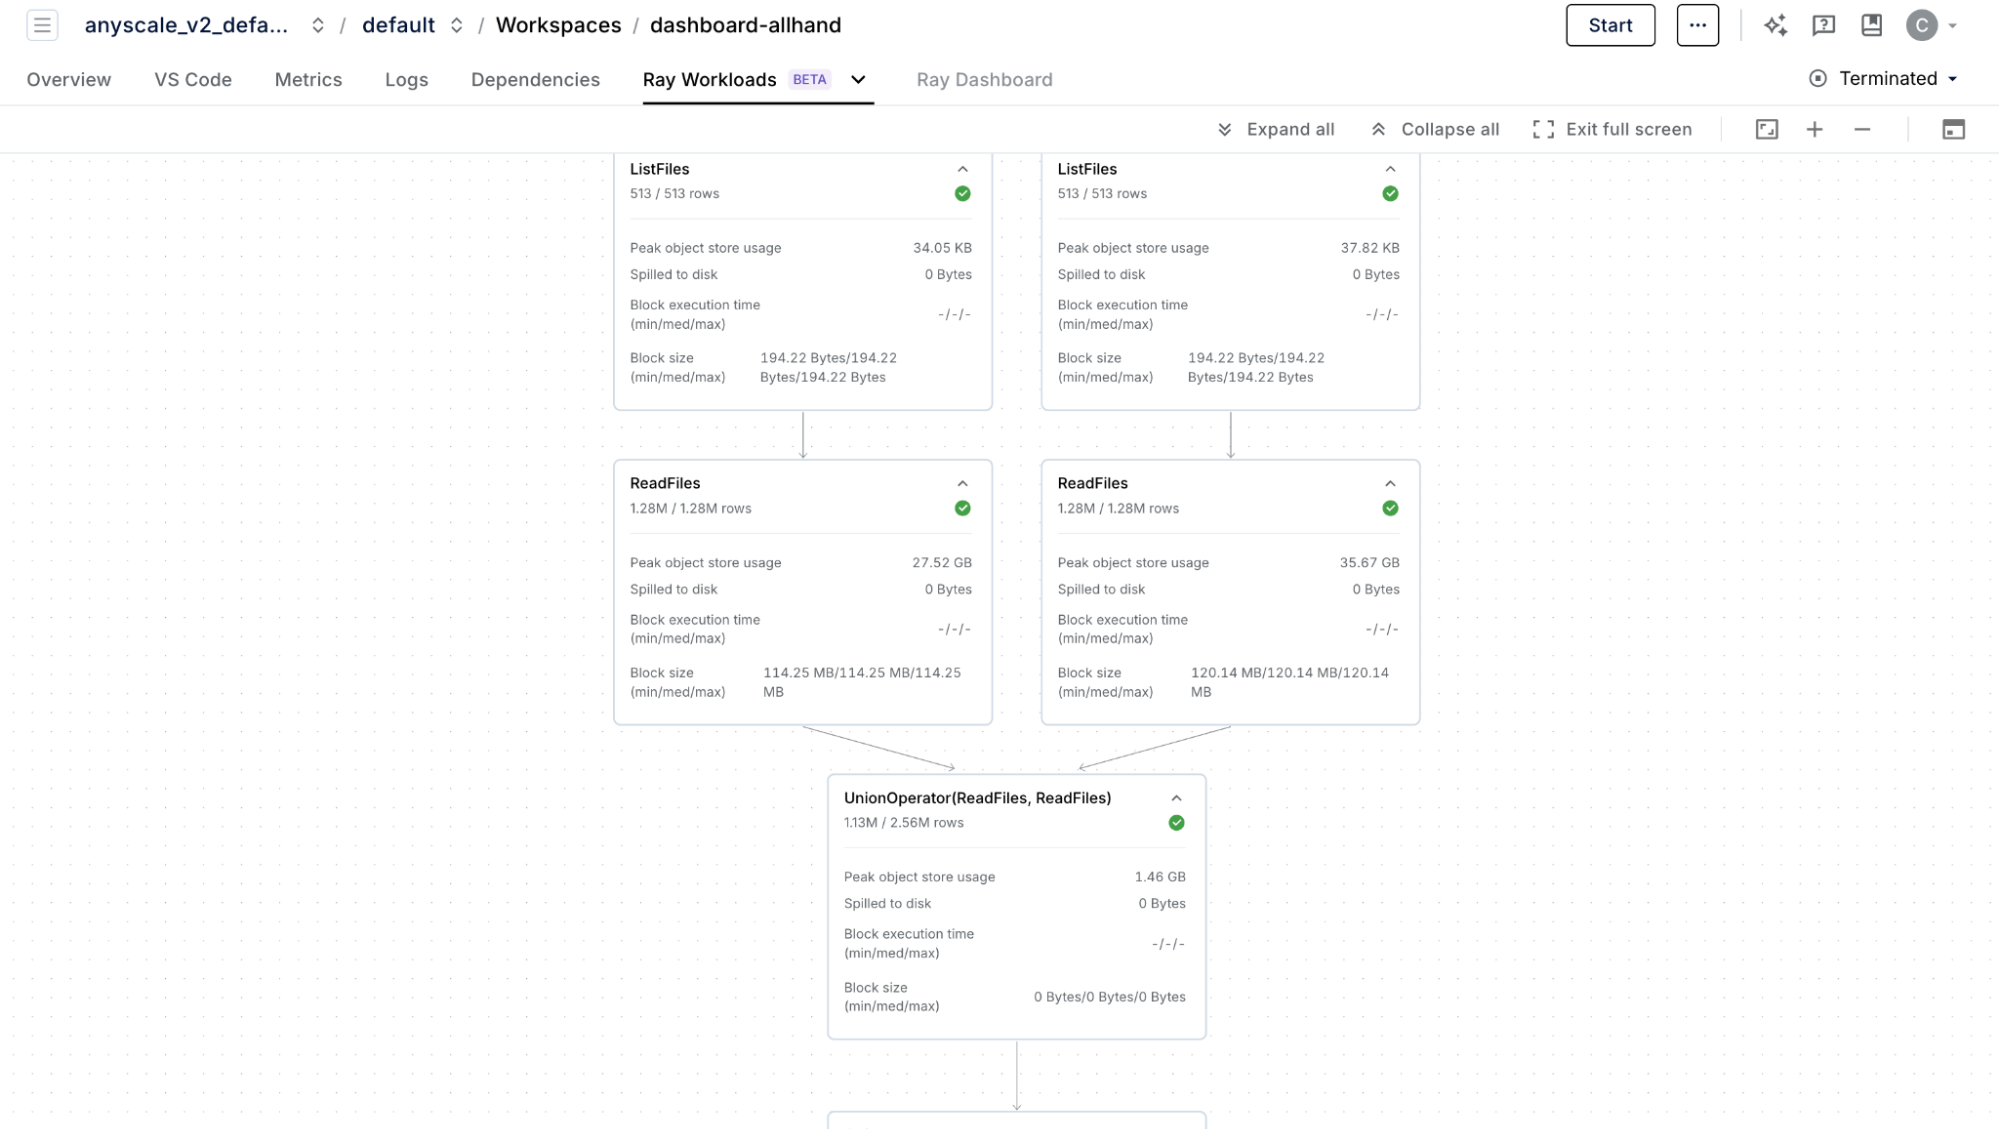
Fig 9. Visualize pipeline execution with new DAG views
Data processing workloads are the foundation of AI services, yet they remain notoriously difficult to debug and optimize when scaled out as part of a distributed pipeline running with Ray. When data pipelines stall, the debugging process can consume hours of valuable development time and waste expensive compute resources.
With the new purpose-built dashboard for Ray Data, available exclusively on Anyscale, teams can address several common challenges encountered in large-scale data workloads with:
Data Pipeline Drilldowns: High-level overviews with easy drilldowns using Tree and DAG views
Bottleneck Insights: Pinpoint bottlenecks with operation-level progress status, resolve using easy to access operator metrics
Dataset-Aware Log Views: Trace and Fix Hidden Issues with Dataset-Aware Log Views
LinkProgress Overview and Drill-Downs with Tree and DAG Views
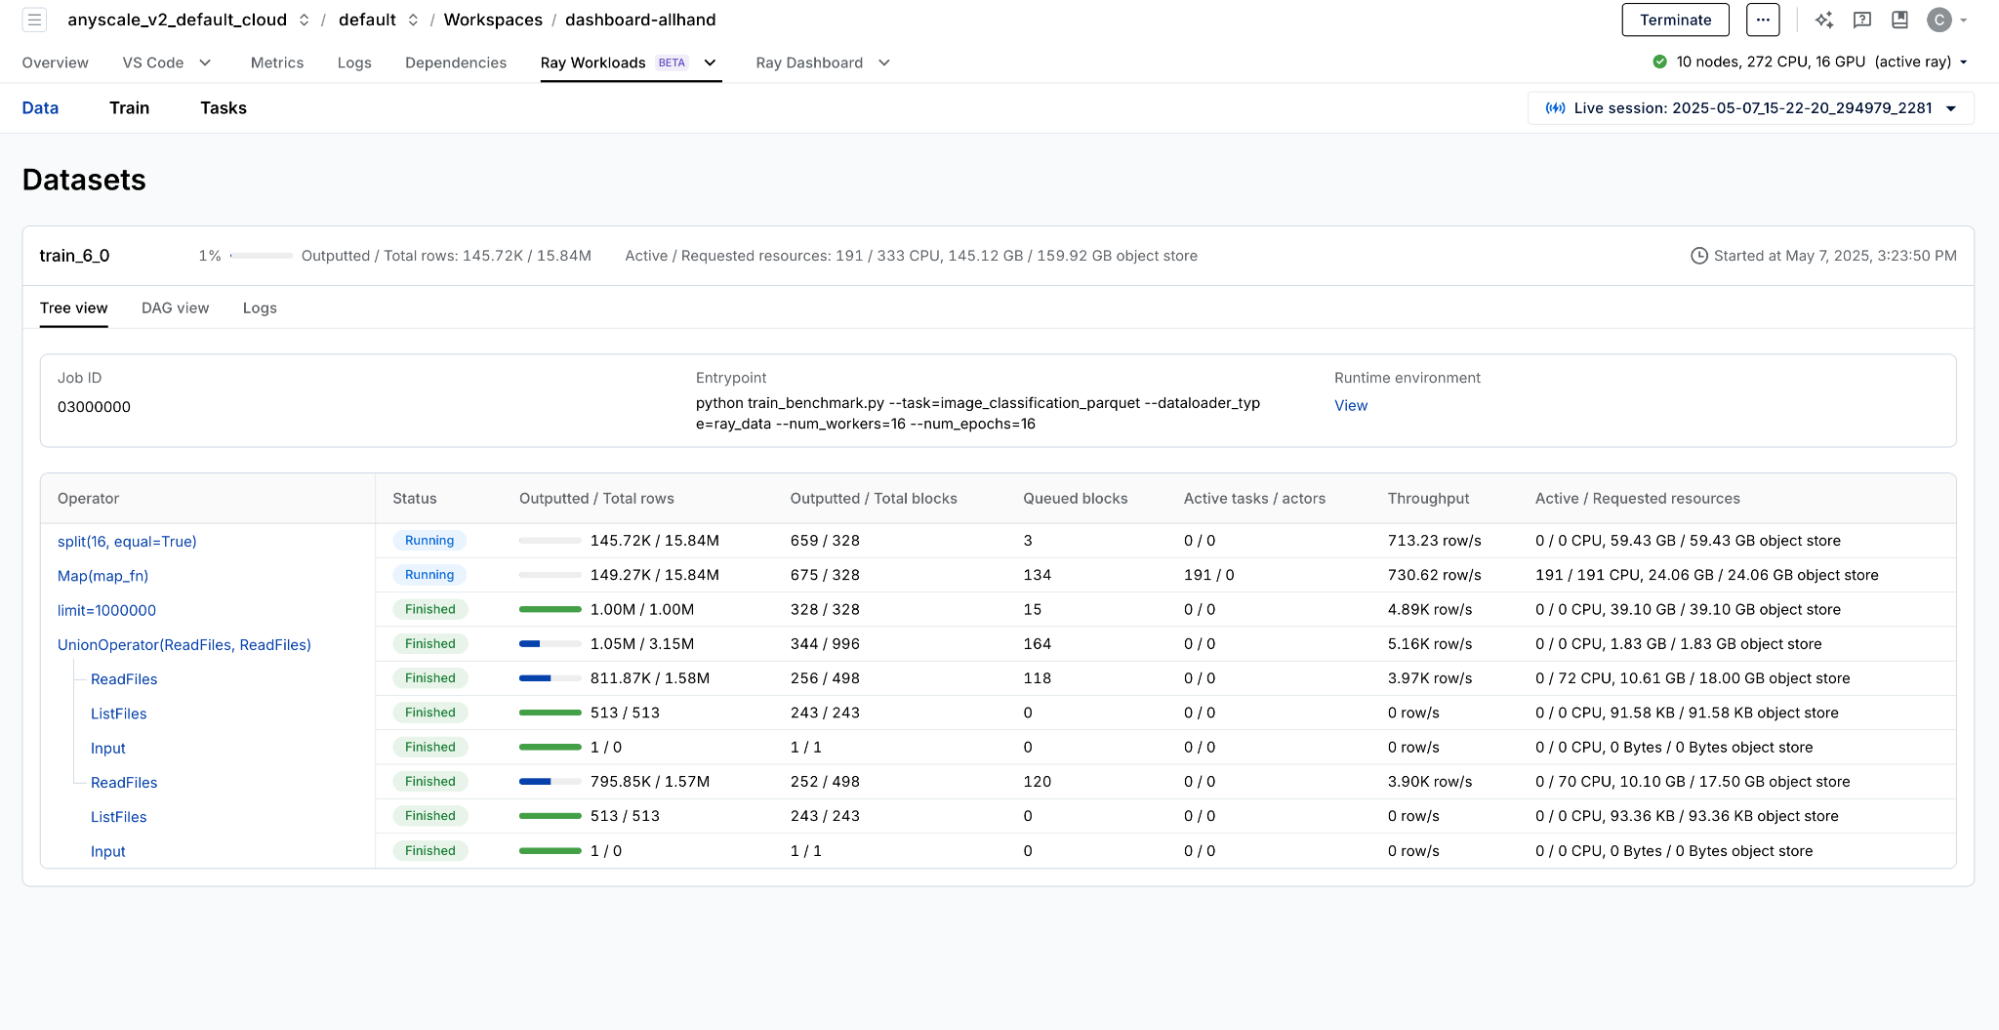
Fig 10. Data Pipeline High-Level Status with Tree Views in Ray Data Dashboard
Ray Data logs provide rich information about pipeline yet it lacks out-of-the-box visibility into the actual structure of your pipeline. To quickly reveal your workload’s topology to monitor and debug different stages of a pipeline, The Ray Data Dashboard gives you both Tree and DAG views that reveal your workload's true topology at a glance.
Let's look at a practical example. Imagine you have a data pre-processing workload used for training. As part of this data pre-processing workload, you need to read a high volume of images from multiple S3 data sources.
1dataset_01 = ray.data.read_parquet("s3://...", columns=["image", "label"])
2dataset_02 = ray.data.read_parquet("s3://...", columns=["image", "label"])
3dataset = dataset_01.union(dataset_02).limit(100000).map(map_fn(...))
The Tree view reveals the workload’s general status at a glance. DAG view provides a different set of insights by providing visibility into the pipeline’s progression through various stages. This view shows concurrent read operations, merging steps, and pre-processing activities to quickly verify pipeline is executing as intended – no more guesswork or manual checks about what's actually happening under the hood.
LinkPinpoint and Resolve Bottlenecks with Operator Metrics
Instead of just showing that something is slow, the Ray Data Dashboard in Anyscale takes it one step further by providing additional details that can help you pinpoint exactly where your bottlenecks are.
The dashboard displays essential metrics for debugging, including:
Progress (number of rows processed)
Resource utilization (CPU, GPU, and memory)
Concurrency levels (number of active tasks and actors)
Live and peak throughput
Number of queued blocks
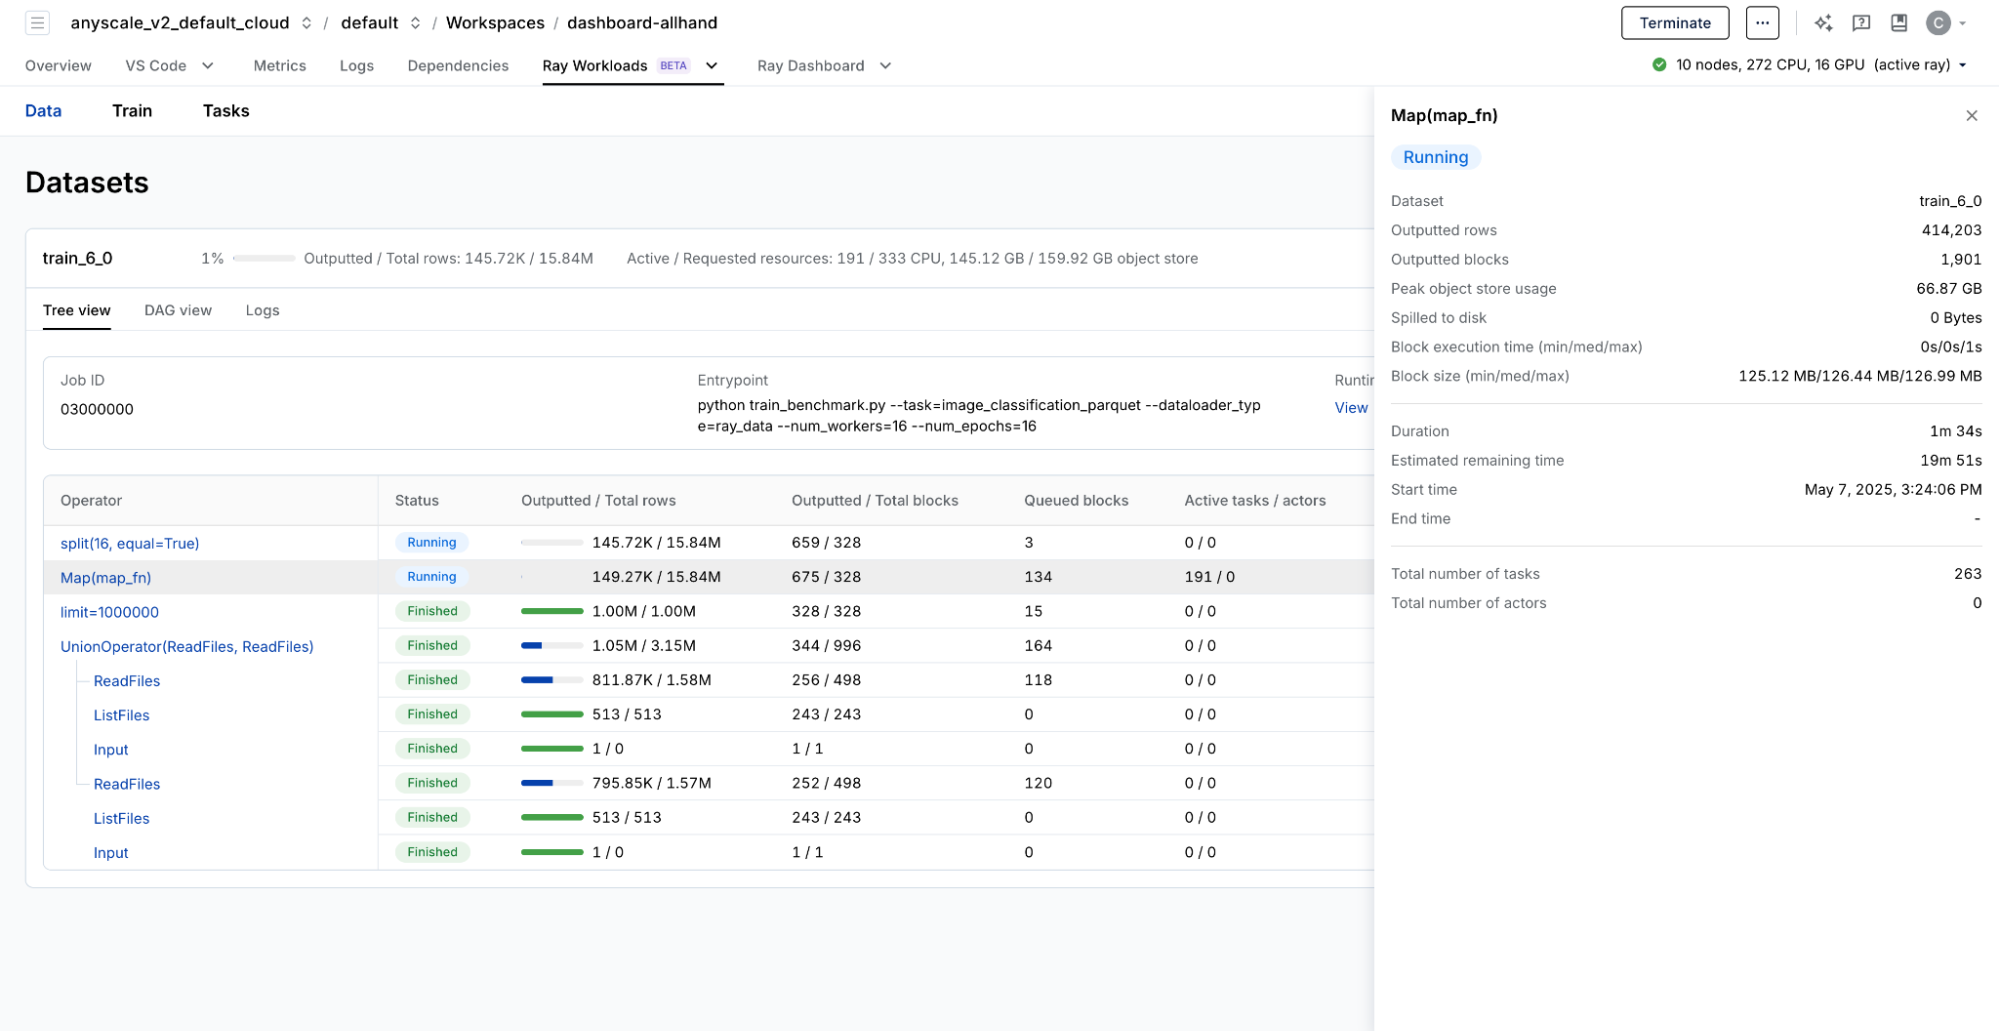
Fig 11. Ray Data Dashboard Operator Metrics View
Taking the example above, the dashboard shows that the Map(map_fn) operator is the bottleneck in the pipeline, as it accounts for the largest share of processing time. However, while the system is running smoothly, the operator is fully utilizing the available resources limiting the throughput. Armed with these types of insights, ML practitioners can take immediate action such as increasing CPU resources to eliminate bottlenecks. In one internal test, simply increasing CPU allocation from 272 to 512 (less than 2x) led to a nearly 4x speedup, reducing job time from over 20 minutes to just a little over 5.
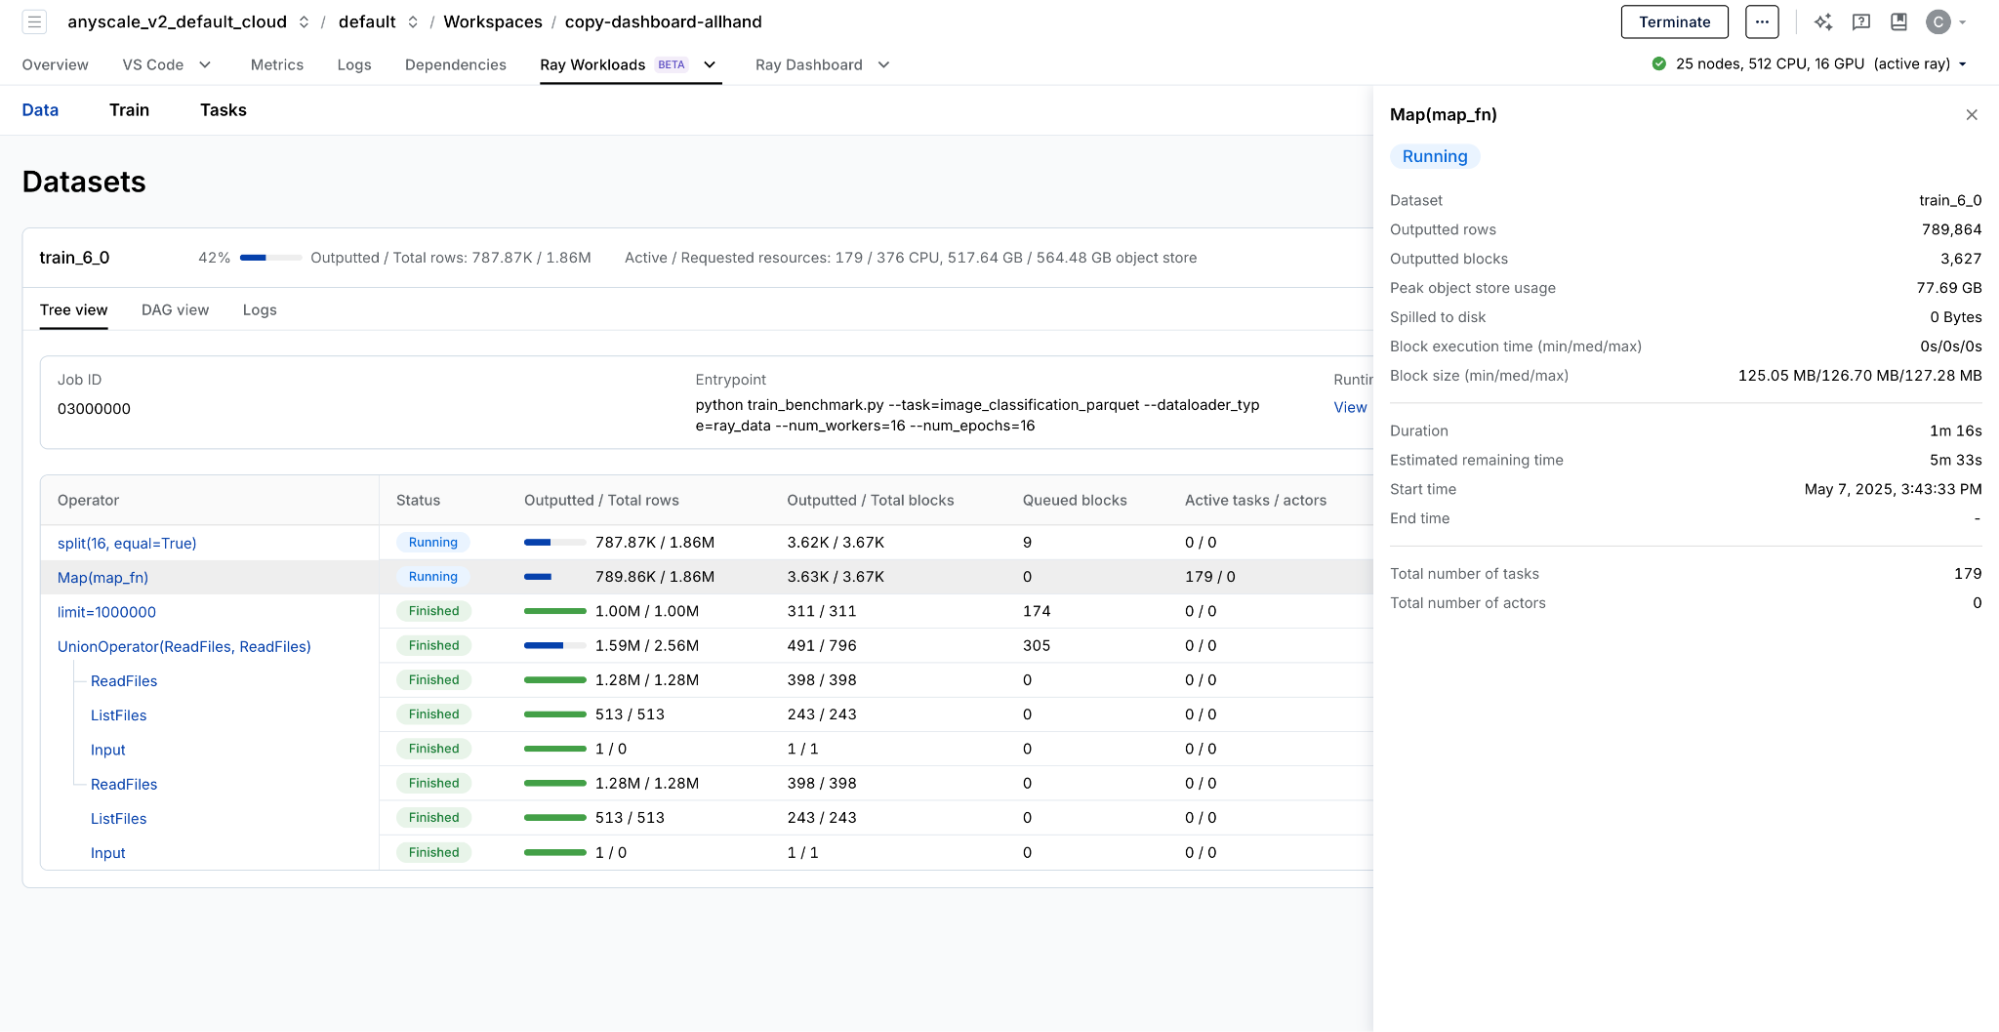
Fig 12. Operation execution post CPU resources increment
Trace and Fix Hidden Issues with Dataset-Aware Log Views
Debugging data issues in distributed systems is notoriously difficult. The Ray Dashboard's Log view automatically captures and highlights problematic data patterns that would otherwise be nearly impossible to detect. The logs are emitted and traced back to the associated dataset by default – no manual setup required. Unlike traditional logging systems, the Log view surfaces both system-level logs and user-emitted logs, making it easy to have complete visibility into your data pipeline.
Let's look at a practical example of how a holistic Log view simplifies debugging.
In the figure below, we see a Ray Data program that has a mailformed data, since the inverse function did not handle 0 value. This program triggers a division-by-zero error during a map function.
1dataset01 = from_items([{"id": 1, "value": 100}, {"id": 2, "value": 0}])
2
3def inverse(batch):
4   return {
5       "id": batch["id"],
6       "value": 1/batch["value"],
7   }
8
9dataset01.map(inverse).materialize()
10
To address this, the Log View emits the exact content of the problematic block (in this case, {`id`: 2, `value`: 0}) along with a stack trace indicating where the error originated.
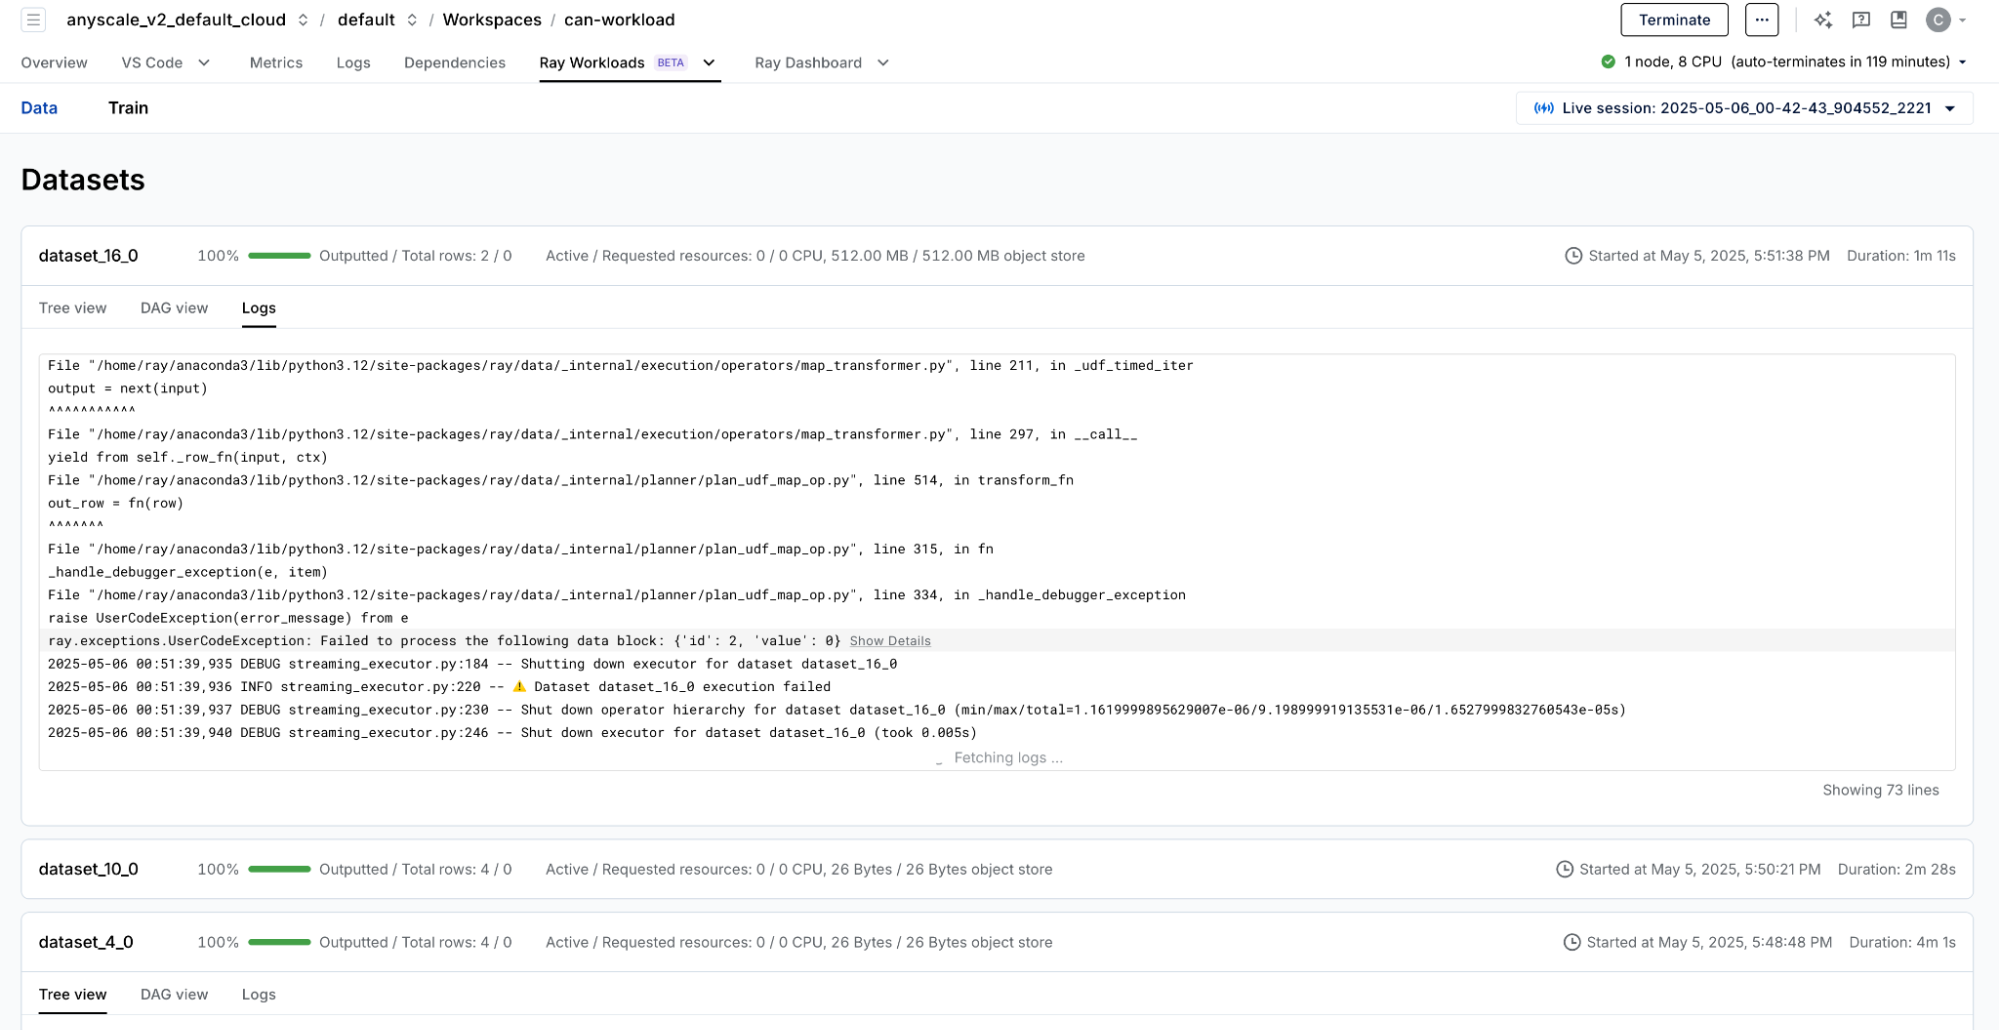
Fig 13. Malformed row data with log view
RayTurbo Data Dashboard’s Log View also allows you to define a custom sampling function to monitor how block data flows through the pipeline – directly within the Log View.
1   def inspection(batch):
2   	 logger = logging.getLogger("ray.data")
3   	 if random.random() < 0.001:
4        logger.info(f"Processing {batch}")
5     return batch
6   dataset = dataset.map(inspection)
7
Fig 14. Sampling data with log view
With these advanced logging features, you can quickly identify and fix issues that would otherwise remain hidden in complex, distributed pipelines.
LinkFuture Enhancements
Both dashboards are actively evolving to provide even more value. Planned enhancements include:
For the Ray Data Dashboard:
Automated issue detection with built-in health checks for stalled operators, high memory usage, and more
For the Ray Train Dashboard:
Integration with the Ray Data Dashboard for end-to-end observability
Support for experiment tracking via Weights & Biases, MLflow, and similar platforms
LinkTry It Today
Whether you're processing massive datasets or training complex models, Anyscale's observability dashboards give you the visibility you need to build, optimize, and scale your AI systems with greater confidence and efficiency.
Ready to see how these dashboards can transform your AI workflows? Get started on the Anyscale Platform today. Sign up now and receive $100 in free credits to experience this purpose-built observability for debugging and optimization design for your distributed applications using Ray.
Table of contents
- Ray Train Dashboard: Unified Observability for Distributed Training
- Unified Interface for Log and Metric Drilldowns
- Clear Visualization of Training Progress and Job State
- Detailed Error Context When Things Go Wrong
- One-Click Profiling for Performance Optimization
- Ray Data Dashboard: Faster Pipeline Debugging with Tree and DAG views
- Progress Overview and Drill-Downs with Tree and DAG Views
- Pinpoint and Resolve Bottlenecks with Operator Metrics
- Trace and Fix Hidden Issues with Dataset-Aware Log Views
- Future Enhancements
- Try It Today
Sign up for product updates
Recommended content

Introducing Vision-Language Reinforcement Learning in SkyRL
Read more
Introducing Anyscale Agent Skills: Build faster, debug smarter, and optimize AI workloads running on Ray
Read more