Introducing Ray History Server: Post-Mortem Observability for Ray on Kubernetes
LinkRay History Server
It is becoming increasingly common for Ray users to utilize Ray clusters as ephemeral units of compute, created for a single job and torn down once the job completes. This pattern improves cost efficiency and resource sharing, especially in capacity-constrained environments where hardware accelerators are scarce.
The trade-off for this approach is, unlike long-lived clusters, session logs, in-memory states, and Ray Dashboard disappear along with the cluster. Users can export logs and metrics to external observability systems, but debugging a failed job means correlating task and actor states, per-node logs, and error traces. The Ray Dashboard is the one place that ties them all together, and without it post-mortem debugging is almost impossible.
With the latest Kuberay v1.7 release, History server is now promoted to beta and available for use, enabling access to Ray cluster data even after termination.
The Ray History Server closes the observability gap by reconstructing the necessary Ray related endpoints after cluster termination.
LinkCluster Selection Page
Before we do a deep dive into history server, let's see what it can do. The history server provides a built-in cluster selection page, which acts as a centralized page for post-mortem observability, dynamically discovering, and cataloging all historical runs stored by the object storage as well as current live clusters.
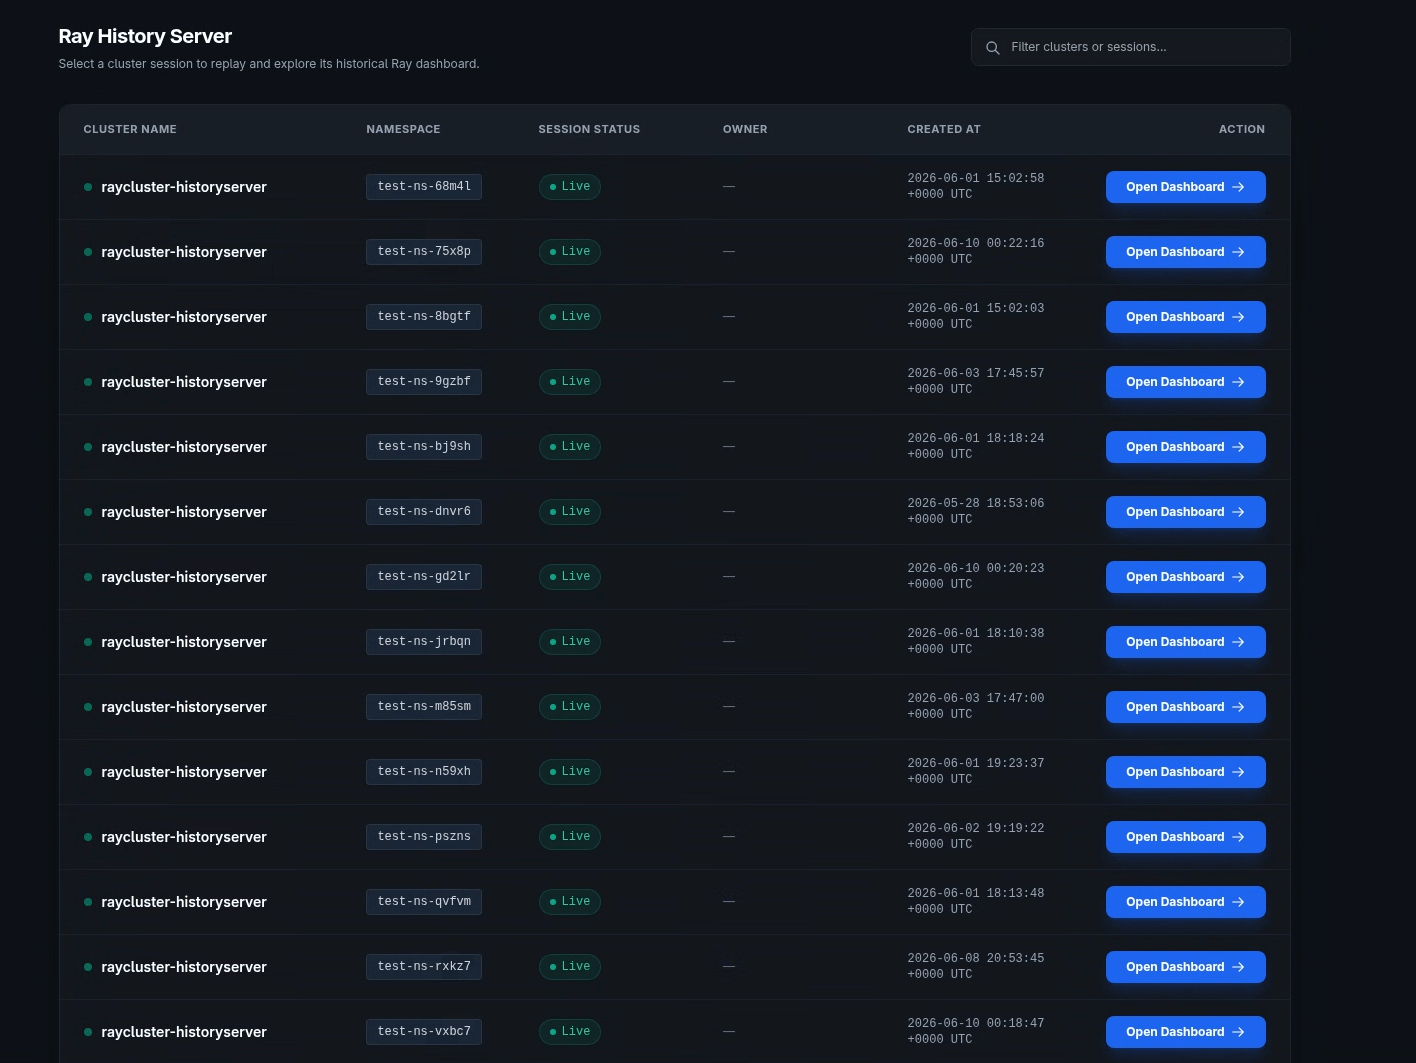
Users can search and filter past or current runs by cluster name, namespace, and owner resource. Each session entry will indicate whether a session is live or terminated. And with a single click on any historical or live session, users will be redirected to the corresponding Ray Dashboard interface.
For terminated sessions, the history server reconstructs the Dashboard from telemetry collected in object storage. For live sessions, it proxies requests to the cluster's running Ray Dashboard, including automatic authentication token injection for clusters with Ray auth enabled, so users get a single entry point regardless of whether a cluster is still running.
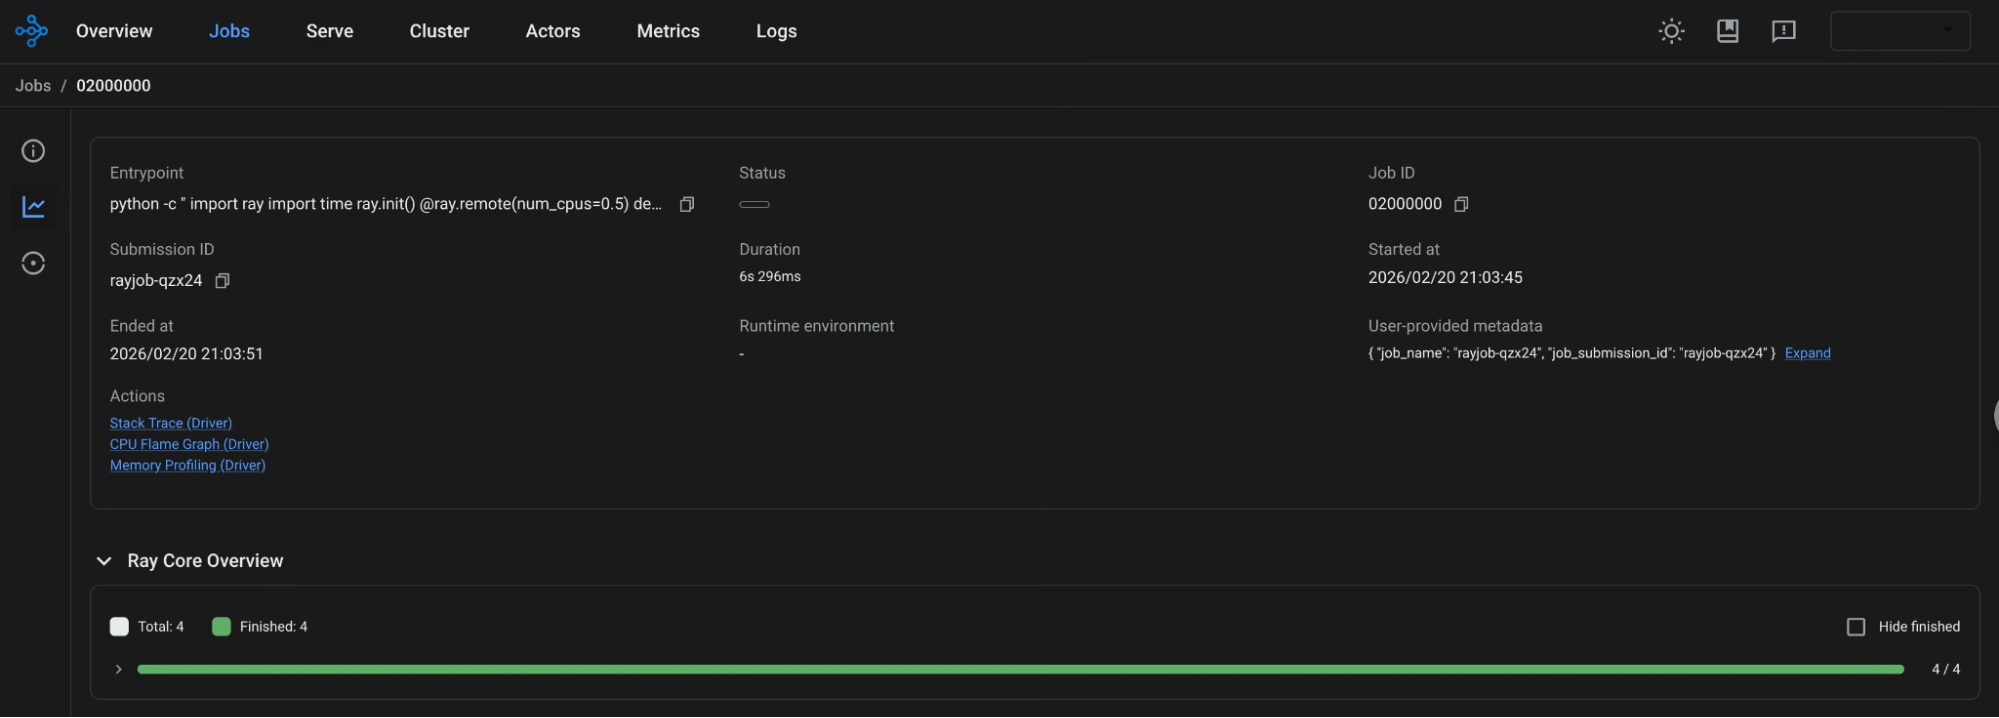
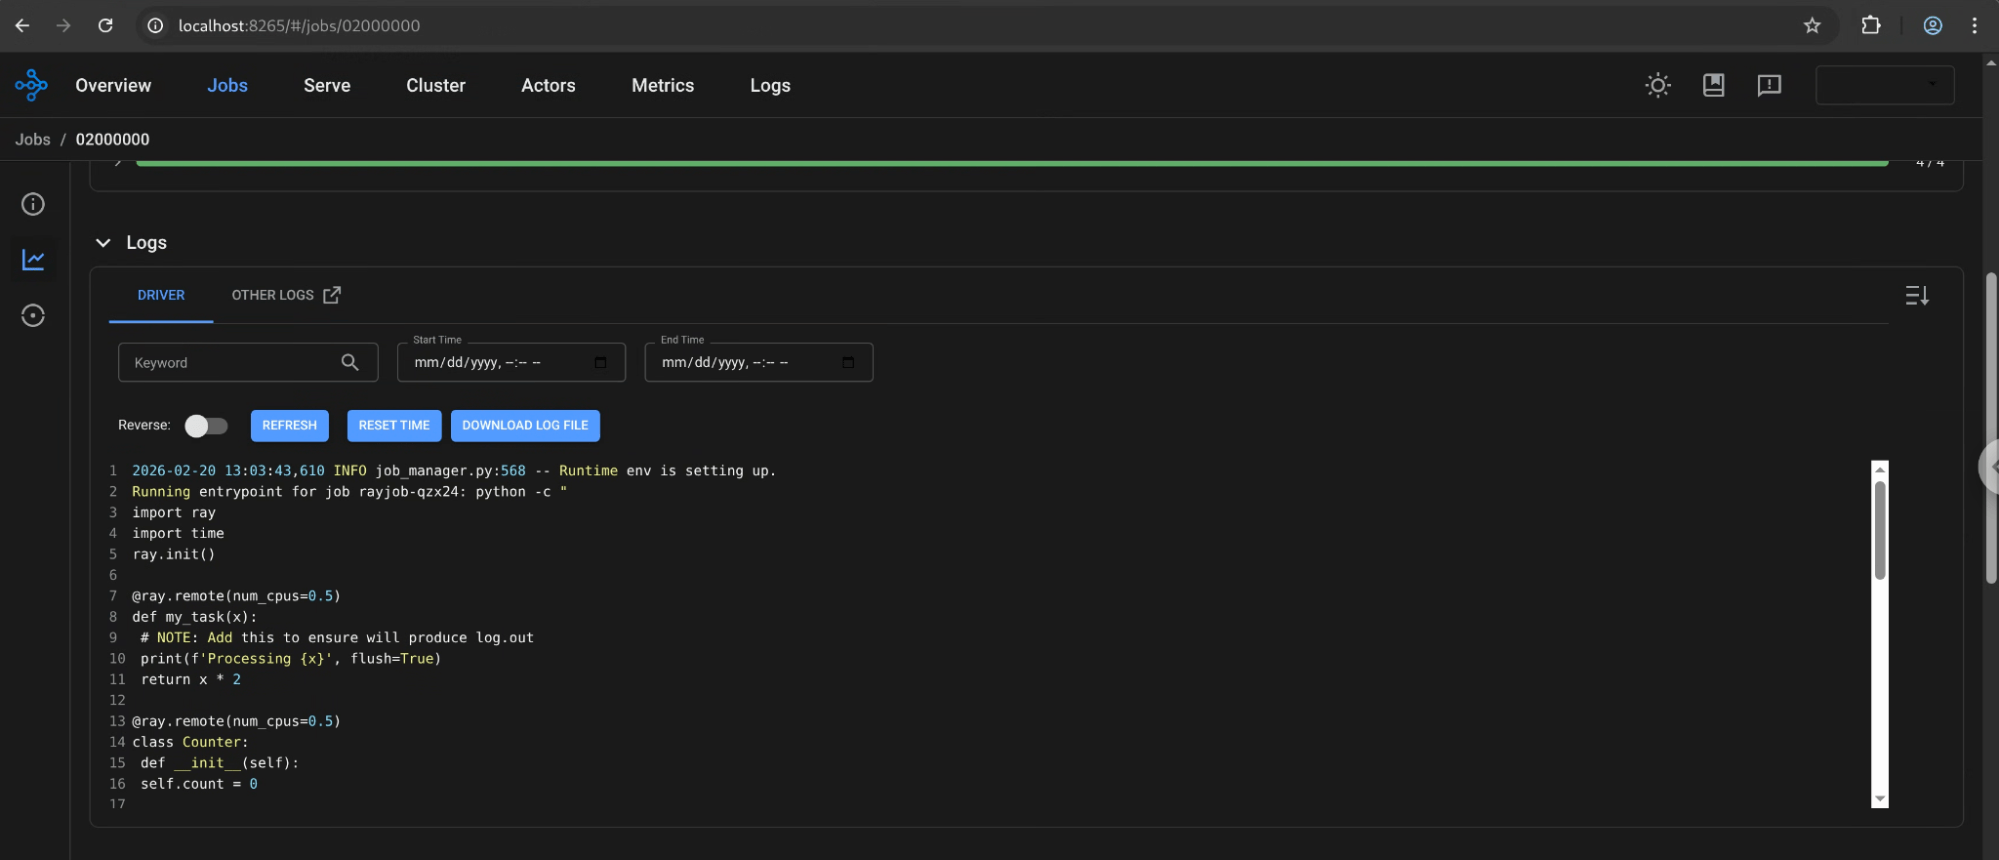
Once a session is selected, the history server serves the standard Ray Dashboard frontend backed by a Dashboard-compatible REST API. Whether a cluster is live or has been terminated for hours or days, users navigate the exact same Dashboard interface they already know and get all the post-mortem context they need without keeping idle clusters around just to preserve access.
LinkArchitecture Overview
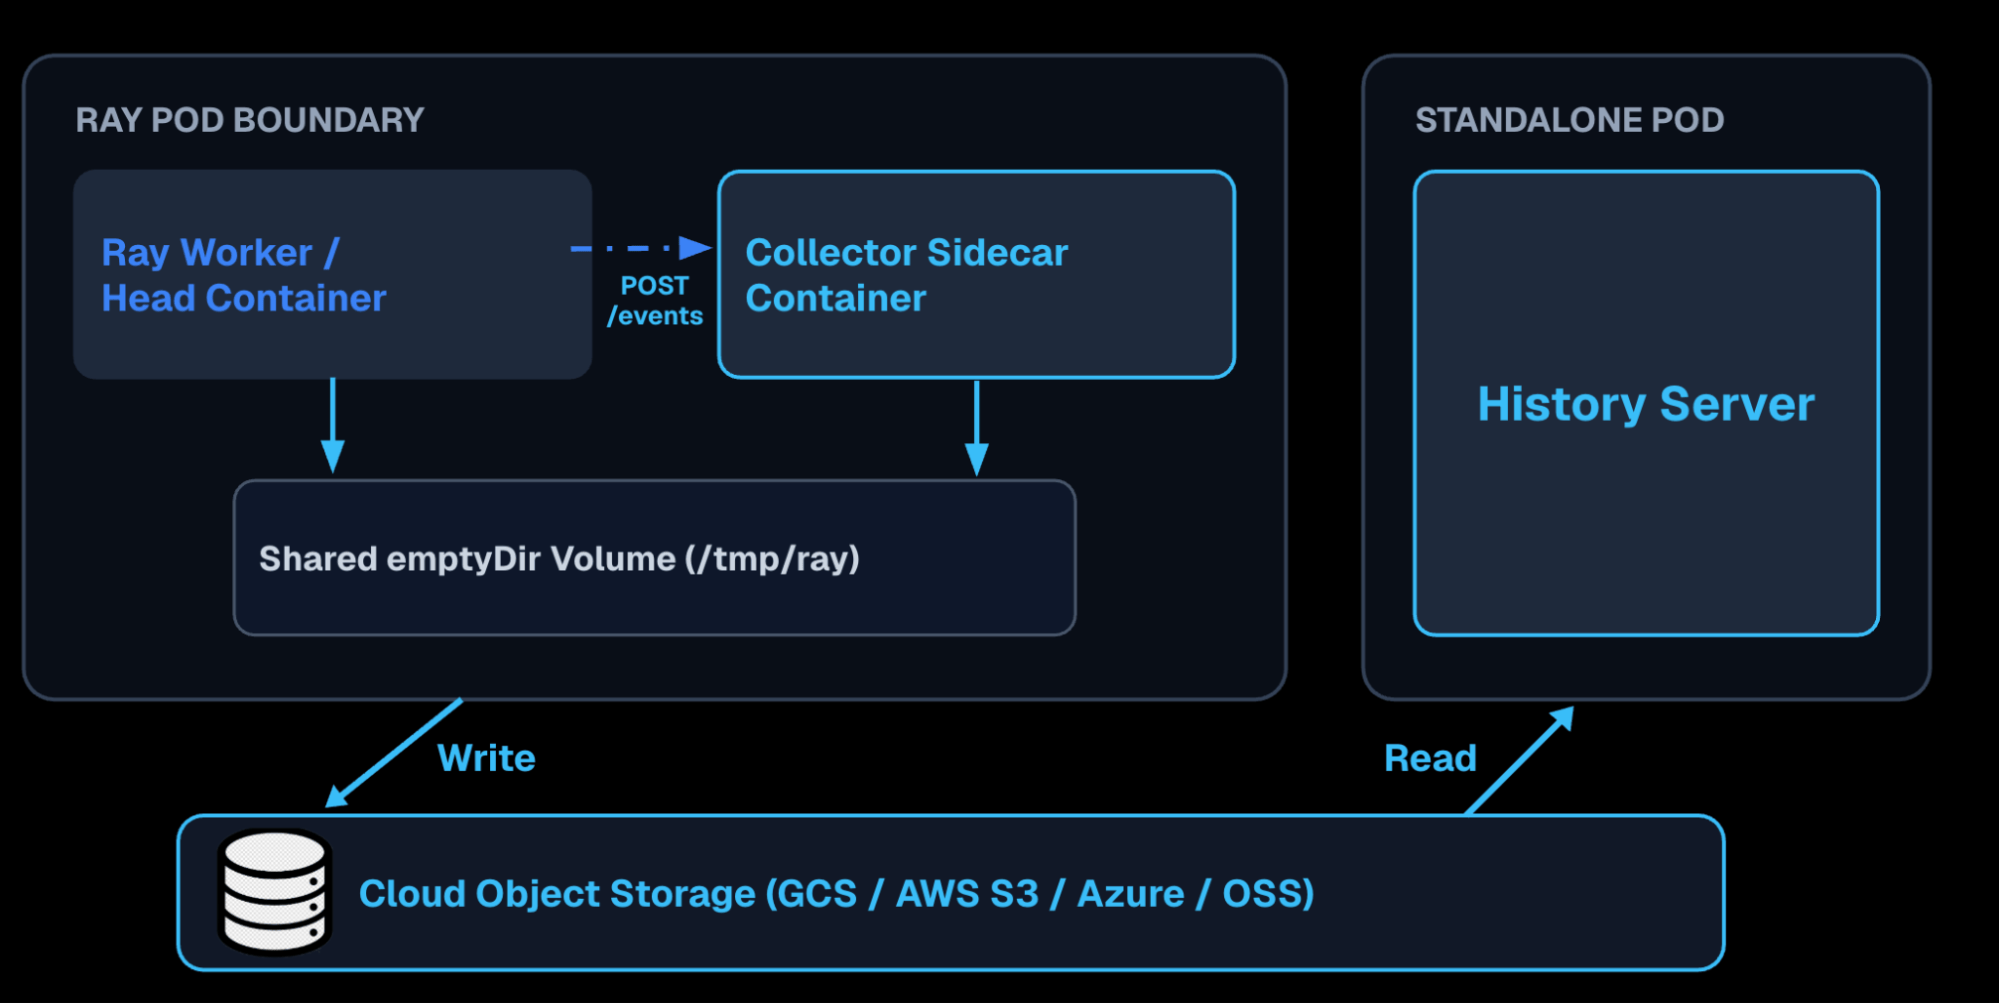
So what exactly goes into the History server? There are two main components that reflect the fundamental difference between the two stages required to reanimate the Ray cluster: recording the data, and replaying the data. The component that is responsible for recording the data is the collector. And the other component, responsible for replaying the data, is the history server itself.
LinkCollector Deep Dive
Let’s start with the collector. The collector is a sidecar that is attached to all of the Ray head and worker pods. And its job, as mentioned above, is to collect data from the corresponding Ray container. Within the collector, there are two main flows or subsystems, one that is in charge of logs, and another that is responsible for Ray events.
The event collector subsystem aims to capture high-velocity telemetry from Ray workloads without consuming too much cluster memory by implementing a disk-first collection approach. With the event export api enabled, Ray containers continually export structured runtime events ranging from driver job lifecycles to node specific events. Rather than buffering millions of events in-memory, the event collector subsystem immediately streams incoming payloads directly to local disk. These files are then automatically rotated based on a configurable time interval or file size thresholds. Files could also be compressed right before being uploaded to cloud object storage to minimize upload and download time. To ensure stability of the collector container as well as the pod, the collector also incorporates a configurable total disk limit with a disk-pressure watermark that will reject incoming event requests with 503 errors in the event of a transient outage or network issue.
While the event collector subsystem tracks structured events, the log collector subsystem, as its name implies, handles the Ray logs and cluster metadata. Its main job is to ensure session logs are uploaded to object storage. Uploads occur at three distinct lifecycle events:
On pod termination: when a RayJob finishes or Kubernetes begins tearing down the pod
On startup & crash recovery: residual logs from previous session will be uploaded
On session transitions: when Ray rotates or starts a new session while still running
Beyond uploading logs to object storage, the log collector also acts as the cluster metadata harvester. On the head pod only, it captures cluster metadata such as Ray version and timezone once at startup, and periodically snapshots Dashboard endpoints that are not reconstructed from events (such as Ray Data datasets and placement groups), so their last-known state remains available after termination.
LinkHistory Server Deep Dive
The history server is the read path of the system: it replays the data the collector wrote. It acts as an on-demand, stateless reconstruction engine for post-mortem debugging. It turns raw, compressed files in object storage back into the native Ray Dashboard experience.
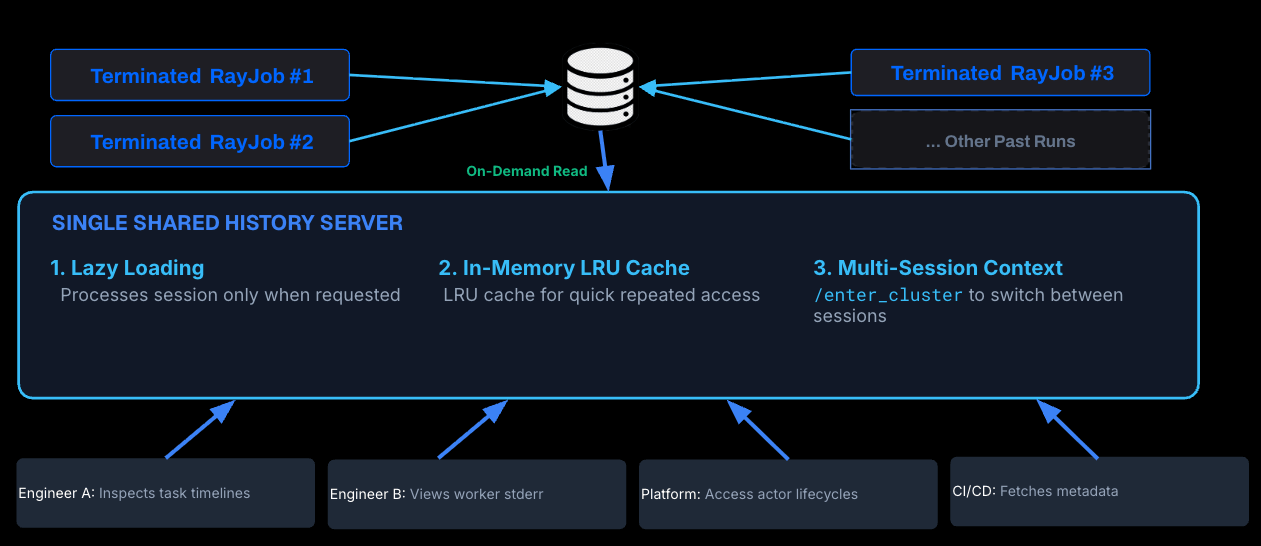
Processing hundreds of event and log files on every request would strain resources, yet maintaining a persistent, pre-processed archive is often expensive and mostly idle. To optimize performance while ensuring stability, the history server utilizes a lazy-loading strategy complemented by an LRU cache.
Lazy Loading: Minimizes requests to object storage and infrastructure overhead by deferring event file retrieval and decompression until a user selects a specific session. This avoids unnecessary reads and eliminates the dependency on a managed database. Concurrent requests for the same cold session are coalesced to prevent thundering-herd reads against object storage, and a configurable timeout guards against indefinite hangs.
LRU Cache: Bounds memory usage with both an entry-count limit and a byte-size budget. Because Ray sessions fluctuate significantly in size—ranging from 2 MB to over 500 MB—these size-based budgets are essential to keeping the history server consistently within its defined pod memory limits.
Thanks to this design, a single history server deployment can serve post-mortem dashboards for many clusters.
LinkObject store
The history server is storage-agnostic by design, built on a single storage interface. This allows organizations to plug in their existing object storage without vendor lock-in. Out of the box, it has native support for the following:
Google Cloud Storage: Native GCS integration supporting GKE workload identity for keyless authentication
AWS S3 & MinIO: Amazon S3 and any S3-compatible object storage, authenticating via IAM Roles for Service Accounts or static credentials
Alibaba Cloud OSS: Aliyun Object Storage Service with RAM Roles for Service accounts
Azure Blob Storage: integrates via Azure Workload Identity or a connection string
The storage layout is deterministic, so any session can be located with a simple prefix lookup, even in multi-tenant environments. Data is organized by resource ownership. Including higher-level resource owners such as RayJob and RayService in the path enables more granular filtering and establishes clear workload provenance. The object storage is broken down into two subtrees.
cluster-metadata: A lightweight index of empty files whose paths encode the namespace, owner, cluster, and sessioncluster-history: The session telemetry – raw logs, event files, and endpoint snapshots
cluster-metadata/
│   ├── raycluster/
│   │   └── <namespace>_<cluster_name>/
│   │       └── <session_name>                # Empty marker file
│   └── <rayjob|rayservice>/
│       └── <namespace>_<owner_name>_<cluster_name>/
│           └── <session_name>
cluster-history/
├── raycluster/
│   └── <namespace>/
│       └── <cluster_name>/
│           └── <session_name>/
│               ├── fetched_endpoints/   # Dashboard endpoint snapshots
│               │   ├── restful__api__v0__nodes__summary
│               │   └── ...
│               └── <node_id>/
│                   ├── logs/
│                   │   ├── dashboard_agent.log
│                   │   ├── raylet.out
│                   │   └── ...
│                   ├── node_events/
│                   │   └── <node_id>-<date_hour>   # Node event logs
│                   └── job_events/
│                       └── <job_id>/
│                           └── <node_id>-<date_hour> # Job event logs
└── <rayjob|rayservice>/
    └── <namespace>/
        └── <owner_name>/
            └── <cluster_name>/
└── <session_name>/ # Same node layout as aboveLinkPerformance & Sizing Benchmarks
We benchmarked the history server data path across sessions ranging from 1k to 50k tasks to verify that it scales linearly. Two tunings were applied: giving the history server at least 1.5 CPU cores, and enabling gzip compression in the collector. Compression cuts storage overhead by ~91%, while the additional CPU speeds up session cold loads by ~2.4x and increases the maximum openable session size by 2.5x.
Metric | Baseline (gzip off, 0.5 CPU cores) | Tuned (gzip on, 1.5 CPU cores) | Impact |
|---|---|---|---|
Event storage per task | ~3.75 KiB (4.3 events at 895 B) | ~355 B (10.85:1 compression) | 91% smaller |
Storage for a 100k-task session | ~385 MiB | ~35.5 MiB | ~349.5 MiB saved per session |
Cold load time per task | ~0.2 ms (CPU-throttled) | ~0.084 ms (unthrottled) | ~2.4x faster |
Max openable session size | ~20k tasks (larger sessions exceed ~5s UI budget) | ~50k tasks (opens in 4.21s) | 2.5x larger |
Performance plateaus at 1.2 cores. Allocating more CPU showed no measurable improvement, so 1.5 to 2 cores is a safe initial sizing recommendation for the history server. Full benchmark details are available in the history server benchmark repository.
LinkFuture Roadmap & Looking Ahead
While the current history server is in beta and provides a robust post-mortem debugging service, there are still enhancements designed to further simplify operations and expand observability.
Automated collector sidecar injection - to make adoption easier, future versions will introduce stable, automated collector injection within the KubeRay operator. Users will be able to enable telemetry collection declaratively within the
RayClusterspec. An early version is already available behind theRayClusterHistoryServerfeature gate viaHistoryServerOptions.Expand metrics and metrics replay - Post mortem debugging often requires inspecting system metrics along tasks, and we aim to include native support for historical metrics timelines by capturing GPU/CPU utilization, memory pressure, and actor throughput.
LinkTry it Today
Ready to bring post-mortem observability to your Ray workloads on Kubernetes? Check out the Ray History Server documentation to set up the collector and history server in your Kubernetes cluster!
Have any questions or need assistance? Feel free to open an issue on the GitHub Repository. We welcome your feedback, feature requests, and contributions! You can also join the Ray Slack and ask questions in the #ray-history-server channel.